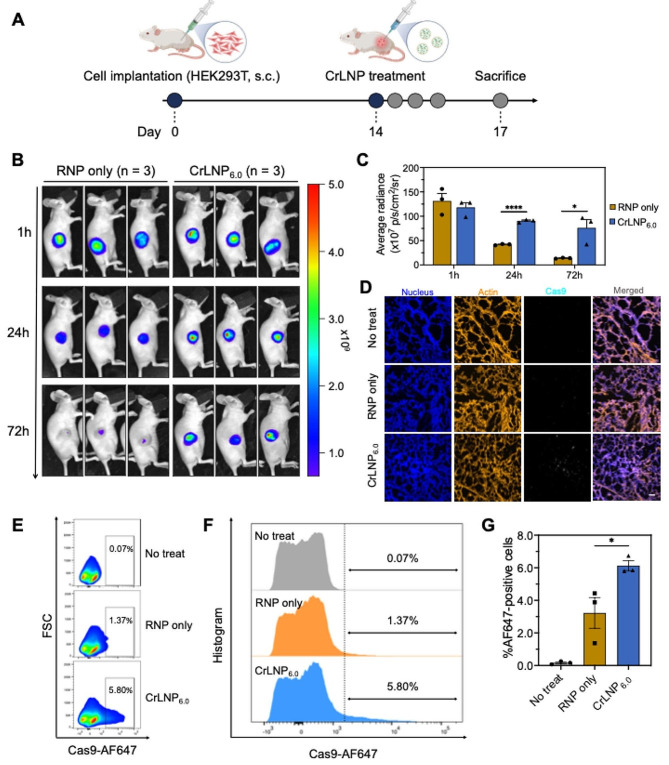
Fig. 5.
In vivo delivery of CrLNPs. A Scheme on the treatment of CrLNP6.0 to HEK293T xenograft mouse model. CrLNP6.0, including AF647-conjugated Cas9, was treated for fluorescence imaging. B IVIS imaging at different time points after intratumoral injection of CrLNP6.0, and C quantification of signals (n = 3). Data are shown as mean ± SD, *P < 0.05, ****P < 0.0001 by student’s t-test. D Confocal microscopy of tumor tissues 72 h after injection of CrLNP6.0. Scale bar, 40 μm. Flow cytometry of cells from tumor tissues 72 h after injection with CrLNP6.0, shown by E scatter plot and F histogram of representative samples for each group, as well as G mean values for each group (n = 3). Data are shown as mean ± SD, *P < 0.05 by one-way ANOVA.

