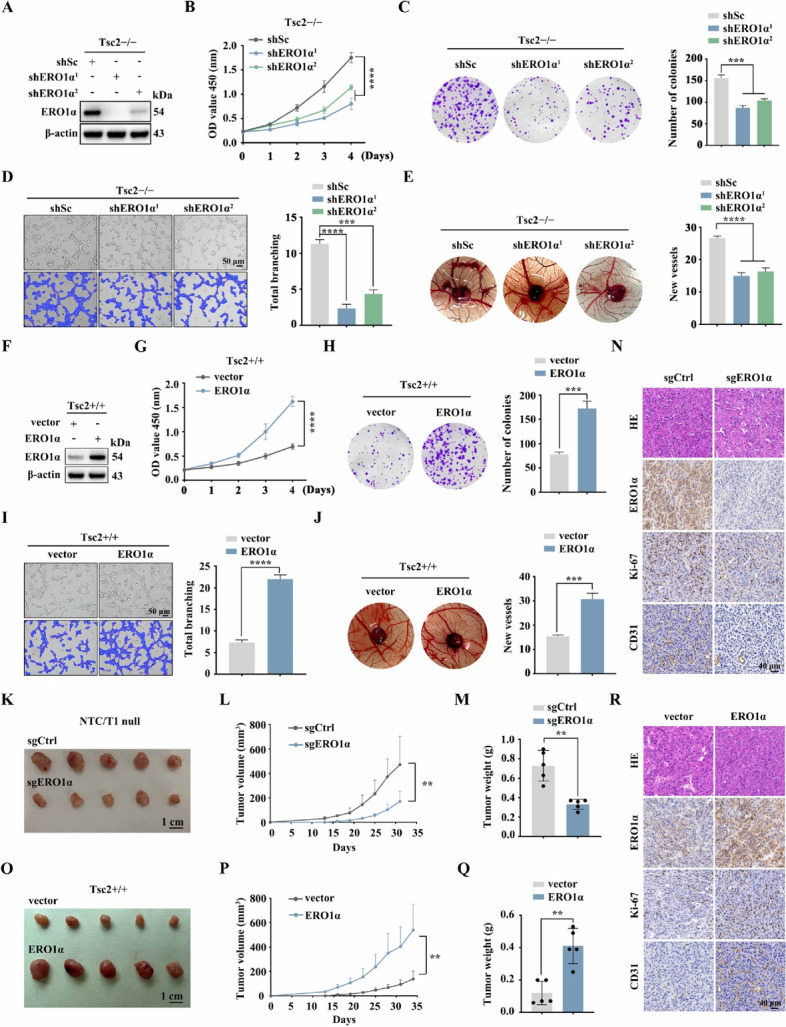
Fig. 2.

ERO1α promotes cell proliferation, angiogenesis, and tumor growth driven by mTORC1 activation. A–E Tsc2 − / − MEFs were transduced with lentivirus expressing shRNAs against ERO1α (shERO1α1 and shERO1α.2) or a scrambled sequence (shSc). F–J Tsc2 + / + MEFs were infected with control (vector) lentiviruses or lentiviruses encoding ERO1α. A–J The expression of ERO1α was assessed by western blotting (A and F); the cell proliferation was evaluated by CCK-8 (B and G) and colony formation (C and H) assays; the effect on angiogenesis was determined by tube formation (D and I) and CAM assays (E and J). Representative images (left panels) and quantifications (right panels). K–R Tumor growth of mice subcutaneously inoculated with the indicated cells. N = 5 for each group. K and O Tumor pictures. L and P Tumor growth curves. M and Q Tumor weight. N and R Representative IHC staining for ERO1α, Ki-67, and CD31 of the indicated tumor tissues. Scale bar, 40 μm. Error bars indicate mean ± SD of triplicate (if mentioned otherwise) samples. **P < 0.01; ***P < 0.001; ****P < 0.0001
