Fig. 3.
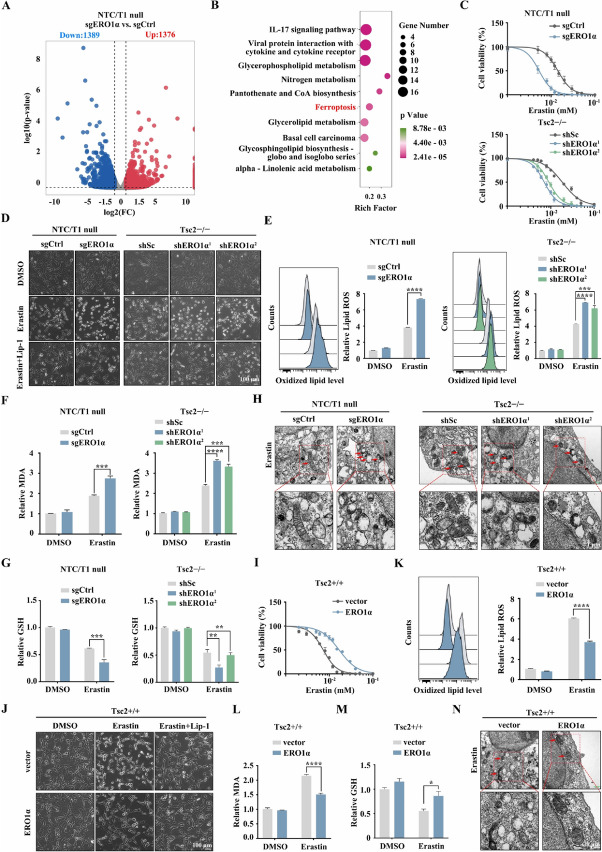
ERO1α facilitates resistance to ferroptosis. A and B sgERO1α and sgCtrl NTC/T1 null cells were subjected to RNA-seq analysis. A Volcano plot of differentially expressed genes. B KEGG enrichment analysis of differentially downregulated genes. C and I Cell viability of the indicated cells following treatment with erastin for 24 h. D and J The indicated cells were treated with or without erastin (10 μM) in the absence or presence of Lip-1 (1 μM) for 24 h. The corresponding phase contrast images are shown. Scale bar, 100 μm. E–G and K–M The indicated cells were treated with or without erastin (10 μM) for 24 h, and then L-ROS (E and K), intracellular MDA (F and L), and intracellular GSH (G and M) were assayed. H and N Representative TEM images of the mitochondrial morphology in the indicated cells treated with 10 μM erastin for 16 h. Red arrows indicate mitochondria. Scale bar, 1 μm. Error bars indicate mean ± SD of triplicate samples. *P < 0.05; **P < 0.01; ***P < 0.001; ****P < 0.0001

