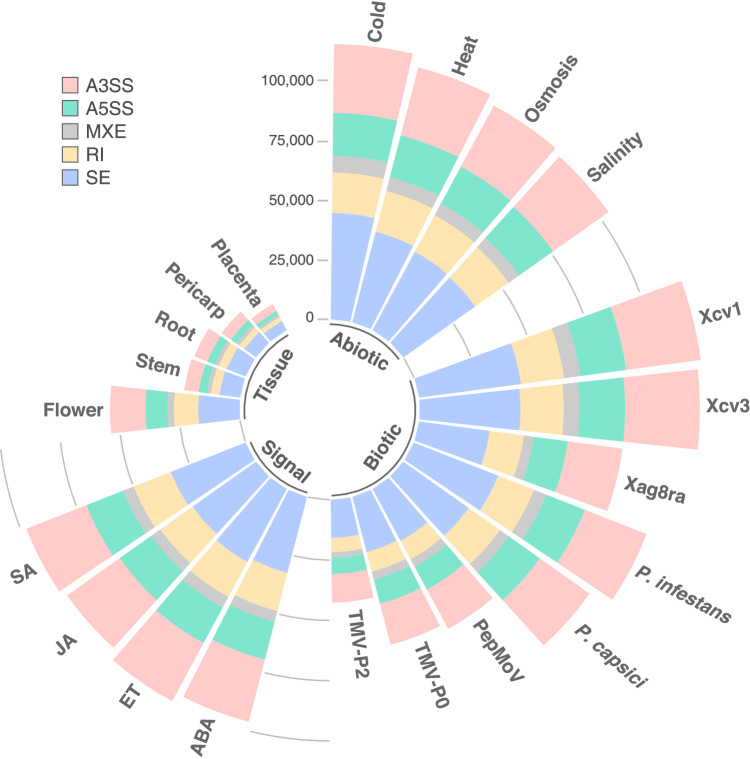
Fig. 2.
Overall patterns of alternative splicing (AS) distribution in Capsicum annuum transcriptome data collected from different tissues and in response to environmental stressors and signaling molecules. The circular stacked bar plot shows the number of AS events (pink-alternative 3′ splice site (A3SS), green-alternative 5′ splice site (A5SS), gray-mutually exclusive exons (MXE), yellow-intron retention (RI), blue-exon skipping (SE) induced by abiotic stressors, biotic stressors, signaling molecules, and in different tissues. Precise numbers of AS events in each group are shown in figshare18.

