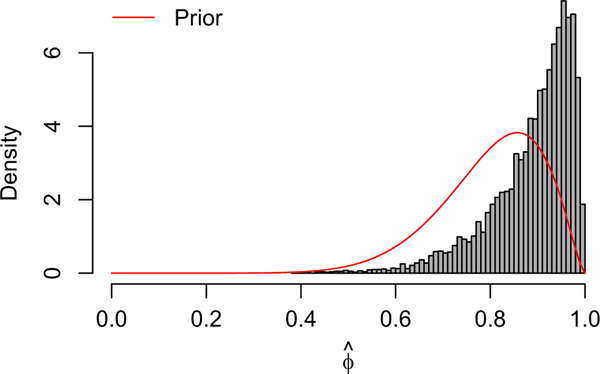
FIGURE C1.
Estimates and 95% confidence intervals for the fully observed all-or-none and leaky models, the ecological vaccine model, and the epidemic-endemic model for 10 years’ worth of weekly data simulated assuming an all-or-none vaccine. Red horizontal lines denote the true parameter values. A, B, C,

