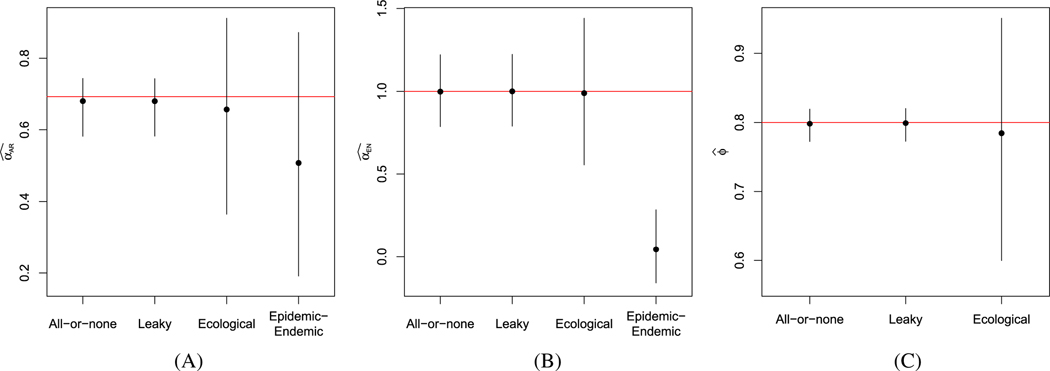
FIGURE 4.
Summary of simulation results of partially vaccinated populations, assuming an leaky vaccine. Average estimates and intervals extending from the 2.5th and 97.5th percentile of estimates across simulations of (A) , (B) , and (C) for the fully observed all-or-none and leaky models, the ecological vaccine model, and the epidemic-endemic model. Red horizontal lines denote the true parameter values. A, B, C,

