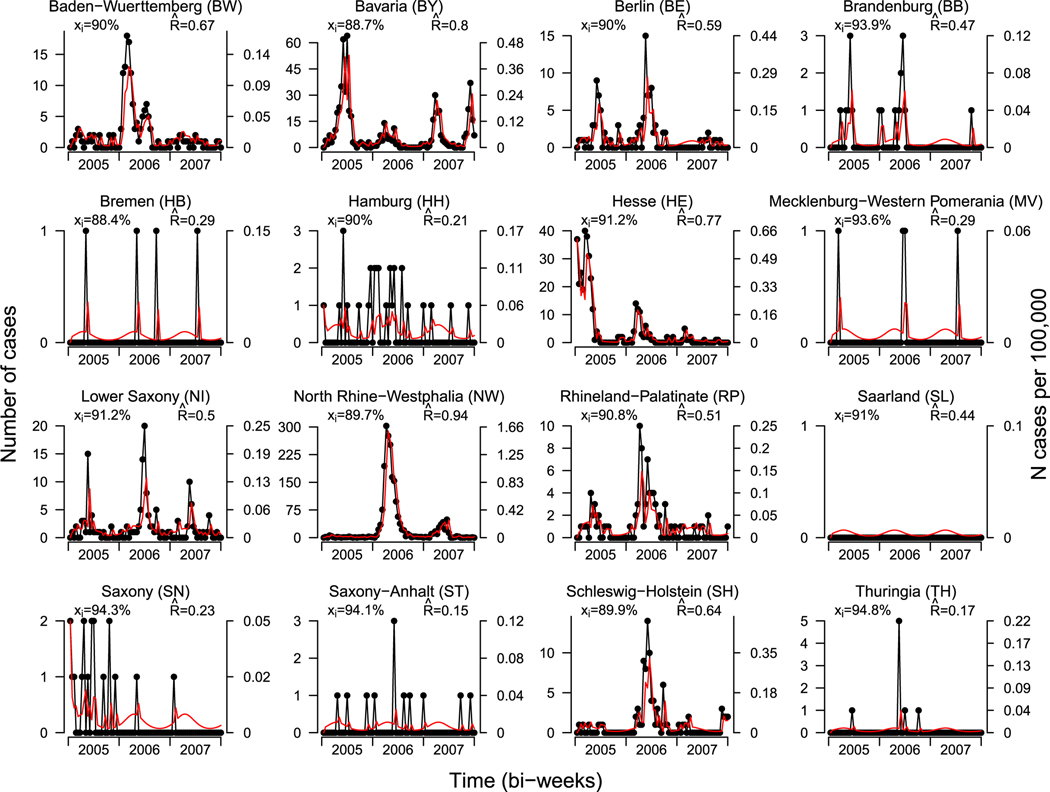
FIGURE 7.
Number of measles cases and prevalence by state and biweek from 2005 through 2007. The left axis indicates the total number of cases; the right axis indicates the prevalence per 100 000 people. Estimated MMR vaccine coverage is included in the upper left corner of each plot. Fitted values from the ecological vaccine model are included in red. Estimated effective reproductive numbers is included in the upper right corner

