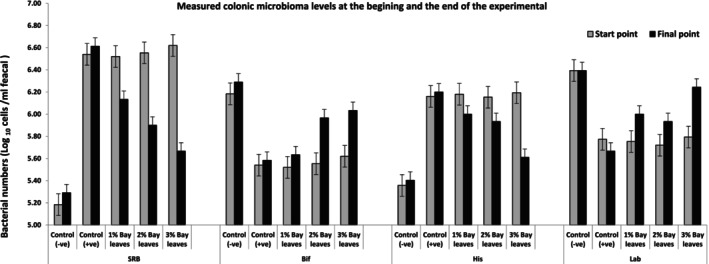
FIGURE 3.

Comparison of the population of colonic bacteria in vivo rat models between the start and the end of the experiment with 7 days of treatment with a bay leaves diet (1%, 2%, and 3%). Control (−ve); Healthy normal rats fed with basal diet without bay leaves; control (+ve): UC rats fed with basal diets without any bay leaves; 1% Bay leaves: UC model fed with a basal diet supplemented with 1% bay leaves; 2% Bay leaves: UC model fed with a basal diet supplemented with 2% bay leaves; 3% Bay leaves: UC model fed with a basal diet supplemented with 3% bay leaves.
