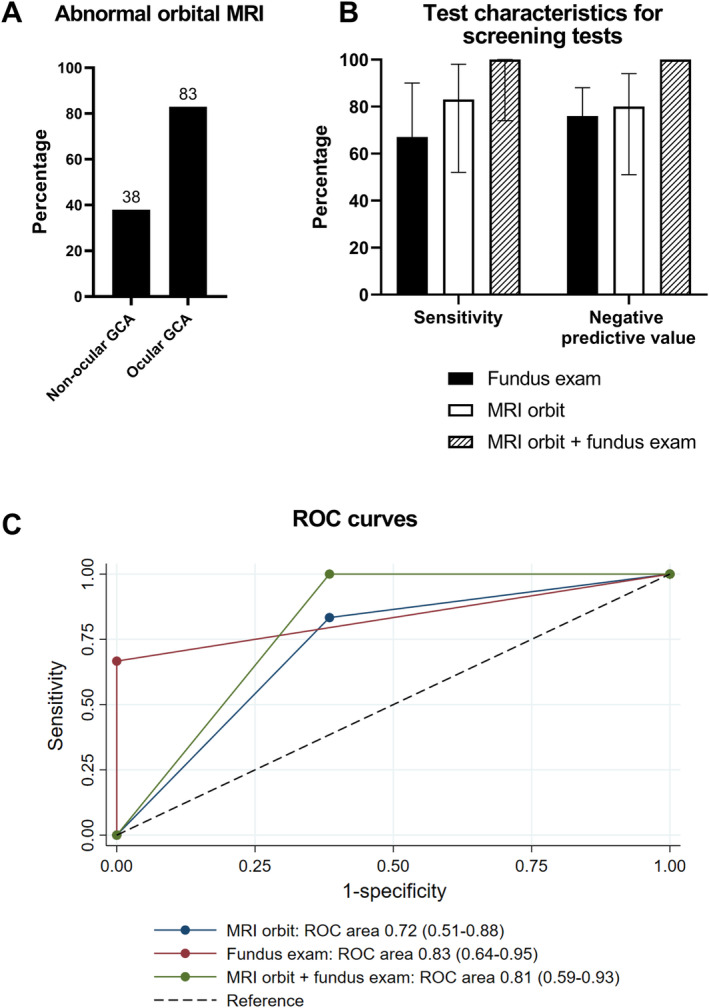
Figure 3.

Diagnostic performance of orbital MRI compared to funduscopic examination for the diagnosis of ocular GCA. (A) Proportion of participants with abnormal orbital MRI enhancement among patients with ocular versus nonocular GCA (P = 0.04). The percentage of patients with abnormal MRI results is shown at the top of each bar. (B) Bar graph with 95% confidence intervals of sensitivity and the negative predictive value of optic disc edema on a funduscopic examination, positive orbital MRI enhancement, or both positive test results for diagnosing ocular involvement among patients with GCA. Combining funduscopic examination with MRI had a negative predictive value of 100%. (C) ROC curves for funduscopic examination, orbital MRI, and both combined in the diagnosis of ocular GCA. GCA, giant cell arteritis; MRI, magnetic resonance imaging; ROC, receiver operating characteristic.
