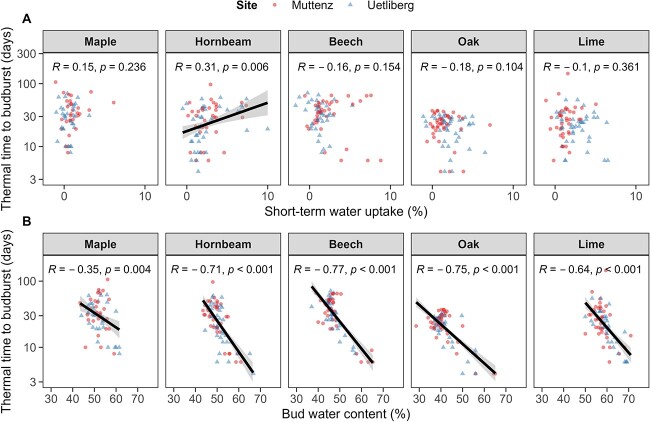
Figure 7.
(A) Correlation between thermal time to budburst and short-term water uptake and (B) bud water content after dormancy induction (i.e., after 07 November 2019). Solid lines and shaded areas in represent model predictions and corresponding 0.90 confidence intervals and points represent the underlying raw data. The different sites are illustrated by triangles for Uetliberg (high-elevation site) and circles for Muttenz (low-elevation site).

