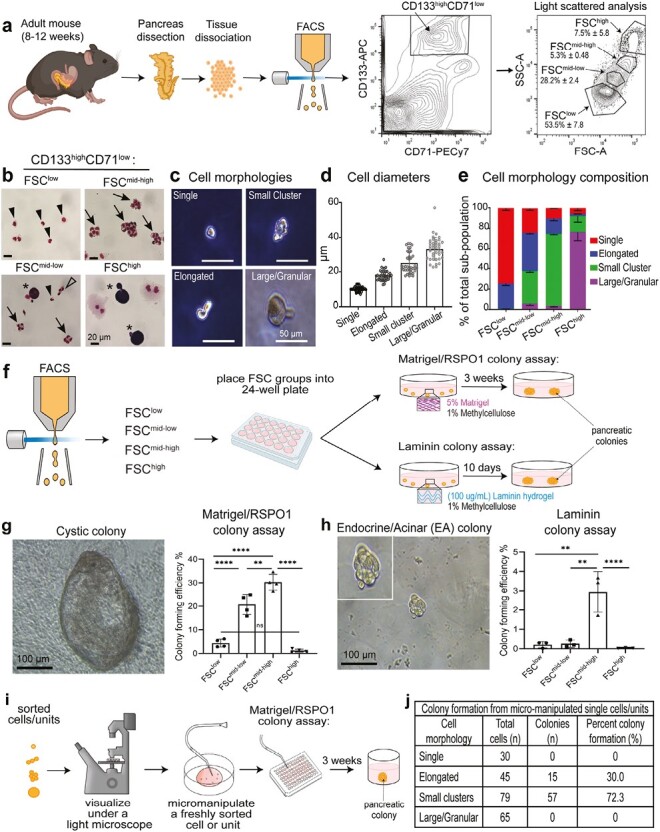
Figure 1.

The ductal CD133highCD71lowFSCmid-high fraction is enriched for cells with “small cluster” morphology and is highly enriched for colony-forming units. (a) Schematic of experimental design with representative flow cytometry analysis. Note that a CD133highCD71lowFSC fraction is abbreviated as “FSC.” (b) Representative photomicrographs of sorted fractions stained with Wright-Giemsa solution. Arrow heads, Single; Unfilled arrow heads, Elongated; arrows, Small cluster; stars, Large/Granular morphology. Scale bar = 20 µm. (c) Representative photomicrographs of cell morphologies observed under a phase-contrast light microscope. Scale bar = 50 µm. (d) Measurement of diameters revealed that different morphologies had sizes consistent with their forward scatter in flow cytometry analysis. n = 2 independent experiments from 5 mice each and at least 20 replicates in each group. Error bars represent SD. (e) Frequencies of each morphology in each sorted subpopulation. Small clusters are most enriched in the FSCmid-high fraction. n = 3 independent sorted experiments for each gate, with 3 different fields of view when counting cell types. Error bars represent SEM. (f) Schematic of experimental design with sorted units placed into either the Matrigel/RSPO1 colony assay (contains 5% Matrigel and 1% methylcellulose) or the Laminin colony assay (contains 100 µg/mL laminin hydrogel and 1% methylcellulose), followed by incubation to produce colonies for subsequent analyses. (g) Representative image of a 3-week-old Cystic colony grown in Matrigel/RSPO1 colony assay (left). Colony-forming efficiency was determined for each FSC fraction (right). n = 5 independent experiments. (h) Representative image of an endocrine/acinar (E/A) colony grown in Laminin colony assay (left) and colony-forming efficiency (right). n = 3 independent experiments. Statistics were performed using one-way ANOVA multiple comparisons. Error bars represent SEM. (i–j) Schematic of micro-manipulation of various morphologies and plating into Matrigel/RSPO1 colony assay to determine percent colony formation. Among the 79 micro-manipulated small clusters, 72.3% gave rise to colonies, demonstrating a near homogeneous population of progenitor-like cells.
