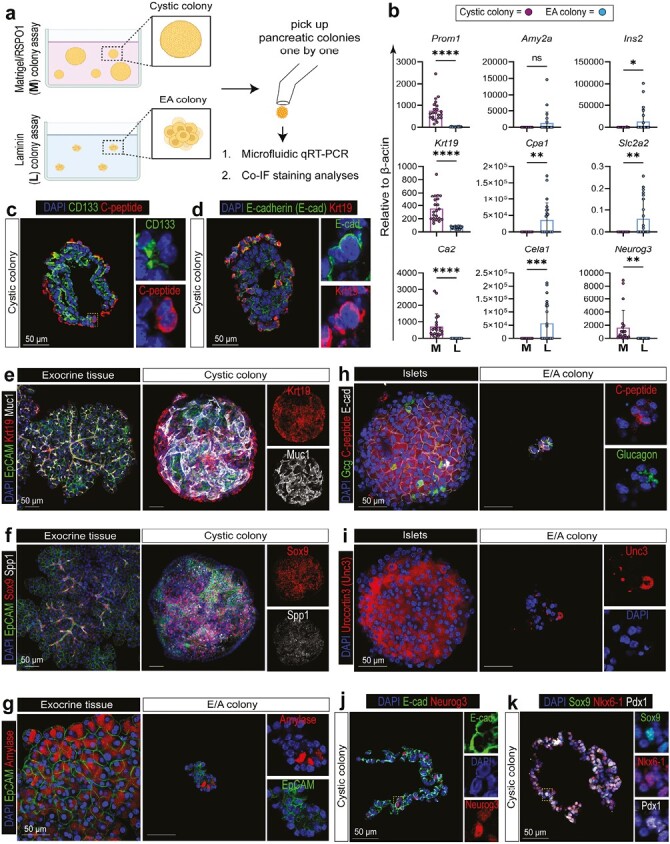
Figure 2.

The small clusters are tri-potent capable of giving rise to ductal, acinar, and endocrine like cells in colonies. (a) Schematic of experimental design. (b) Microfluidic qRT-PCR analysis shows that individual FSCmid-high-derived colonies grown in Matrigel (M) preferentially express ductal (Prom1, Krt19, Ca2) and endocrine progenitor cell markers (Neurog3), while those grown in laminin (L) preferentially express acinar (Amy2a, Cpa1, Cela1) or endocrine markers (Ins2, Slc2a2), consistent with our prior finding.30 Each dot represents a colony. n = 22-23. Statistics were performed comparing cystic vs E/A colonies using 2-tailed Student’s t-test. Error bars represent SD. (c–d) Immunofluorescence (IF) staining of Cystic colonies in frozen sections with epithelial (E-cadherin), ductal (CD133, Krt19), and endocrine (C-peptide) markers. (e-i) Whole-mount IF staining with ductal (Krt19, Muc1, Sox9, Spp1) in cystic colonies, as well as acinar (amylase) and endocrine markers (C-peptide, glucagon, Urocortin 3) in E/A colonies. EpCAM and E-cad are epithelial cell markers. Exocrine or islet tissues served as positive controls. (j–k) IF staining of Cystic colonies in frozen sections with endocrine progenitor (Neurog3) and pancreatic progenitor cell markers (Sox9, Nkx6-1, Pdx1). Dashed boxes are enlarged on the right. Scale bars = 50 µm.
