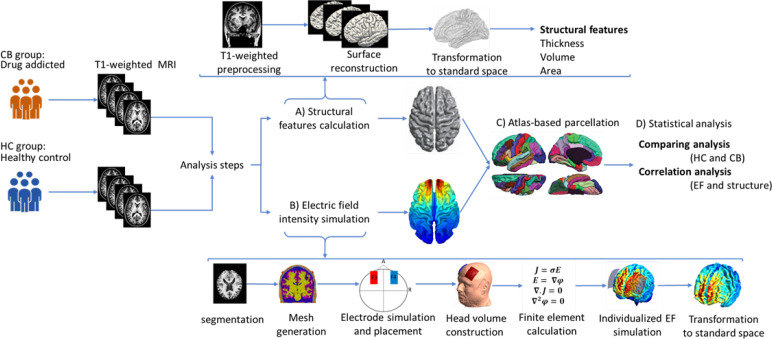
Figure 1.
Workflow for data analysis
Notes: T1-weighted anatomical images were collected in a separate magnetic resonance imaging study from two groups of subjects: Cannabis users (CB group; n=20) and healthy controls (HC group; n=22). Structural magnetic resonance imaging was analyzed in two separate lines in the next step. A) Extraction of structural characteristics: Structural magnetic resonance imaging was preprocessed in Freesurfer; after surface reconstruction for all of the subjects, each brain surface was transformed to fsaverage standard space, and structural features of the brain, including thickness, volume, and area were calculated at the group-level. The general linear model determined between-group differences regarding cortical morphology metrics; B) Electric field intensity simulations; in the second line of analysis, surface-based computational head models were simulated based on the following steps: Segmentation of the T-weighted images, calculation of the head volume meshes, modeling and placement of two 5×7 cm2 electrode pads, simulation of the bilateral transcranial direct current stimulation montage aimed at the dorsolateral prefrontal cortex stimulation (anode/cathode over F3/F4 in EEG 10–20 standard system with 2 mA current intensity), calculation of finite element method, predict electric field intensity distribution for each individual, and transformation of the models to the standard fsaverage space. Similar to structural data, a general linear model was used for group-level analysis of CHMs; C) Atlas-based parcellation: A surface-based anatomical atlas (Desikan-Killiani) was applied to the brain surfaces. The computational head models’ structural features and electric field intensity were calculated in each brain region; D) Statistical analysis: Correlation between electric field and cortical metrics was calculated for each individual and group. Linear mixed-effect models were used to investigate the effects of cortical metrics on induced electric fields.

