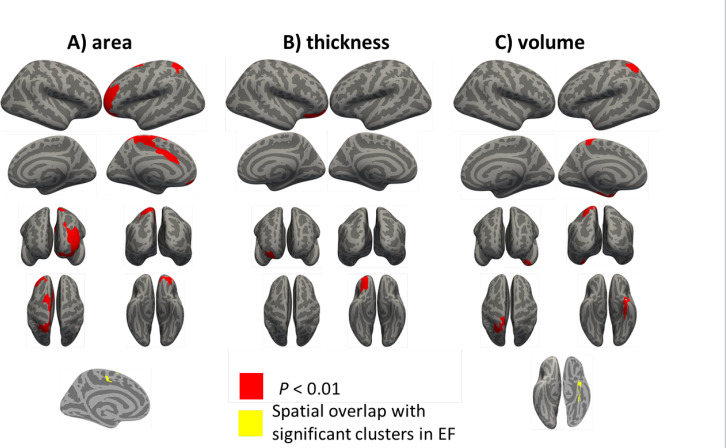
Figure 2.
Group-level analysis of cortical measurements
A) Surface area, B) Thickness, C) Cortical volume based on a general linear model analysis in Freesurfer
Notes: The results from whole-brain vertex-wise analysis of cortical measurements between cannabis users (CB group) compared with healthy controls (HC group). All of the results are related to HC>CB contrast. Statistical maps are depicted on the inflated surface to allow visualization of sulci (dark gray) and gyri (light gray). Regions that remained significant following a cluster-based multiple comparison correction procedure are depicted (cluster-wise threshold, P<0.05). The lower row is related to the spatial overlap of regions demonstrating significant differences in EFs (illustrated in Figure 3) and significant differences in D) Surface area and E) Cortical volume among the CB group compared with HC
No spatial overlap was found between significant clusters in electric fields and cortical thickness

