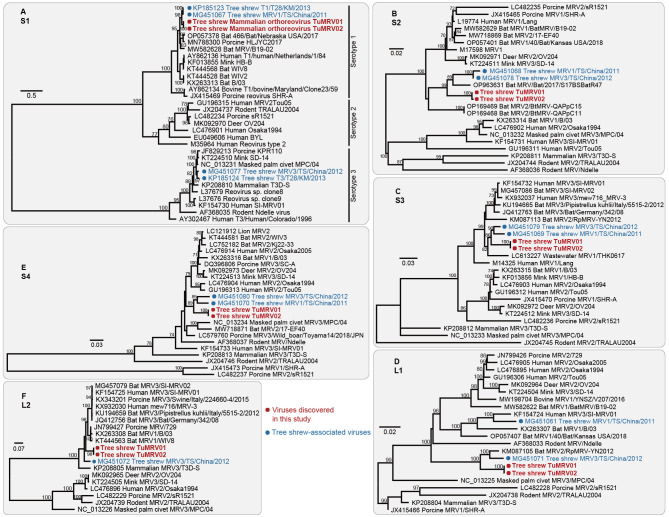
Figure 5.
Phylogenetic analysis of nucleotide sequences from tree shrew virus TuMRV and representative MRV viruses
A: S1 gene; B: S2 gene; C: S3 gene; D: L1 gene; E: S4 gene; F: L2 gene. Scale bars represent number of amino acid substitutions per site and bootstrap values >70% are shown for key nodes. Novel TuMRV strains are highlighted with a red dot, and trees were mid-point rooted.

