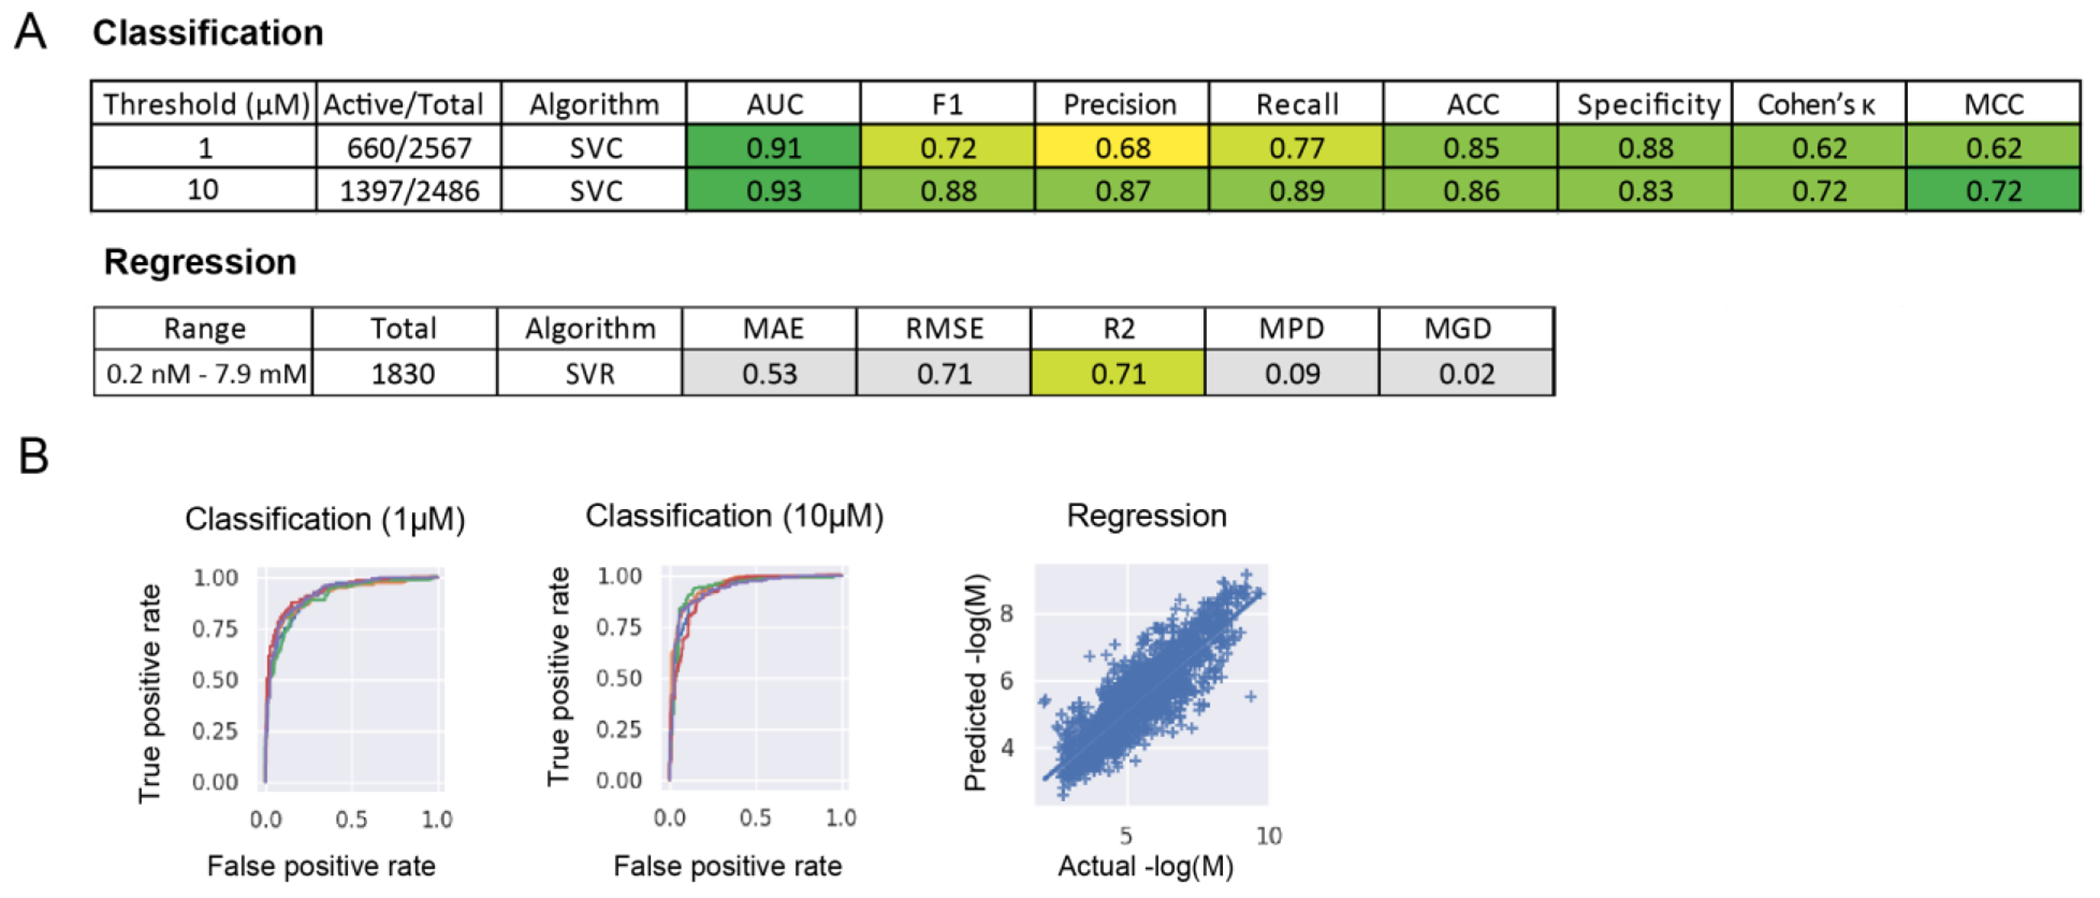
Figure 5. Machine learning models for HBV inhibition.

(A) Threshold or range, number of compounds, algorithm, and nested, 5-fold cross validation statistics for HBV inhibition modelsbuilt with training data from ChEMBL. (B) ROC plots for classification models (SVC) built with a 1μM or 10μM threshold (each line represents a single fold) and the predicted versus actual AC50 values (−logM) for a SVR regression model.(SVC=Support vector machine classification, SVR=Support vector machine regression, AUC=ROC “area under the curve”, F1= F1 score, ACC=Accuracy, MCC=Matthews Correlation Coefficient, RMSE= Root of the Mean of the Square of Errors, MAE=Mean of Absolute value of Errors, MGD=Mean Gamma deviance regression loss and MPD=Mean Poisson deviance regression loss)
