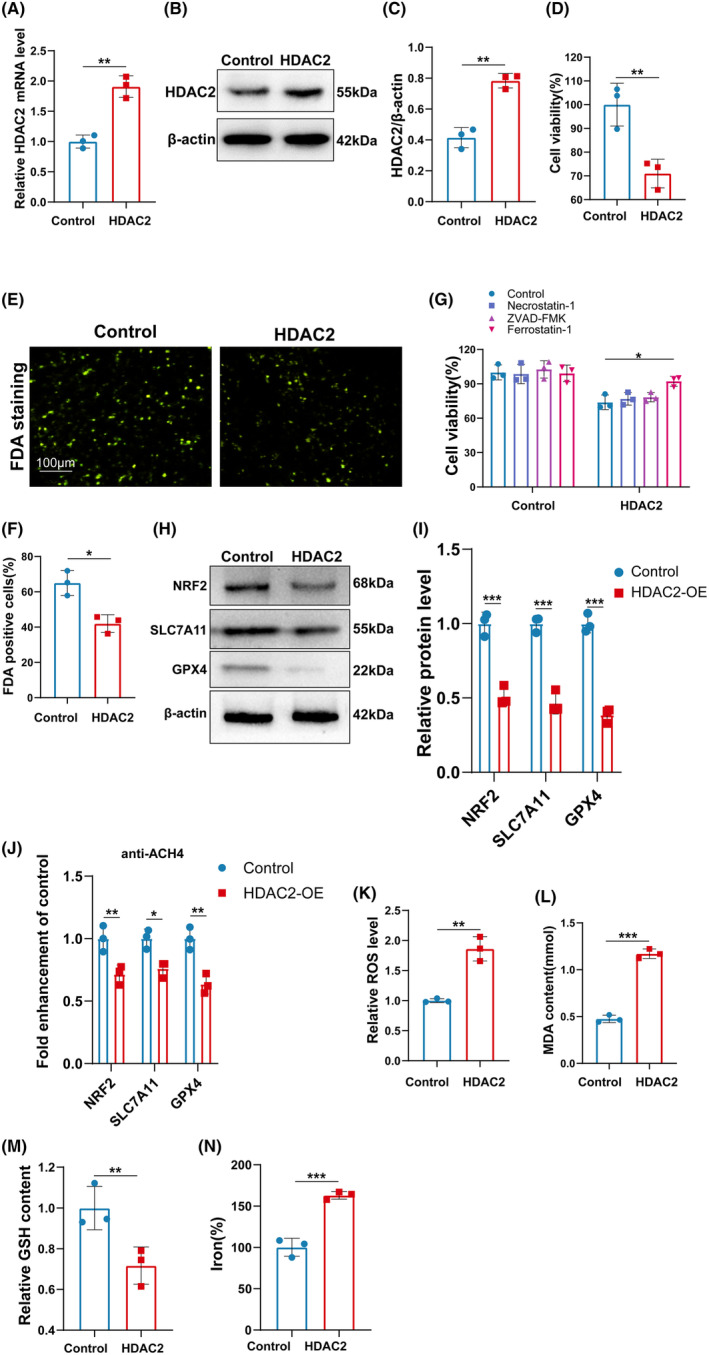
FIGURE 7.

HDAC2 facilitated the ferroptosis of DRG in vitro. (A) The mRNA of HDAC2 was assessed by qRT‐PCR. **p < 0.01. (B and C) Western blotting and semi‐quantifications for HDAC2 in DRG cells with or without HDAC2‐OE. **p < 0.01. (D) DRG cell viability was assessed by CCK8. **p < 0.01. (E and F) DRG cell viability was assessed by FDA staining. *p < 0.05. (G) DRG cell viability treated 1 μM of Ferrostatin‐1, 10 μM of ZVAD‐FMK, or 10 μM of necrostatin‐1 was assessed by CCK8. *p < 0.05. (H and I) Western blotting and semi‐quantifications for NRF2, SLC7A11, and GPX4 in DRG cells with or without HDAC2‐OE. ***p < 0.001. (J) Changes in histone acetylation in GPX4, SLC7A11, and Nrf2 promoter regions DRG cells with or without HDAC2‐OE, sonicated chromatin was IP anti‐AcH4 and quantified with qRT‐PCR. *p < 0.05; **p < 0.01. (K–N) ROS level, MDA content, GSH content, and iron‐level DRG cell with or without HDAC2‐OE were assessed by Elisa assay. **p < 0.01; ***p < 0.001.
