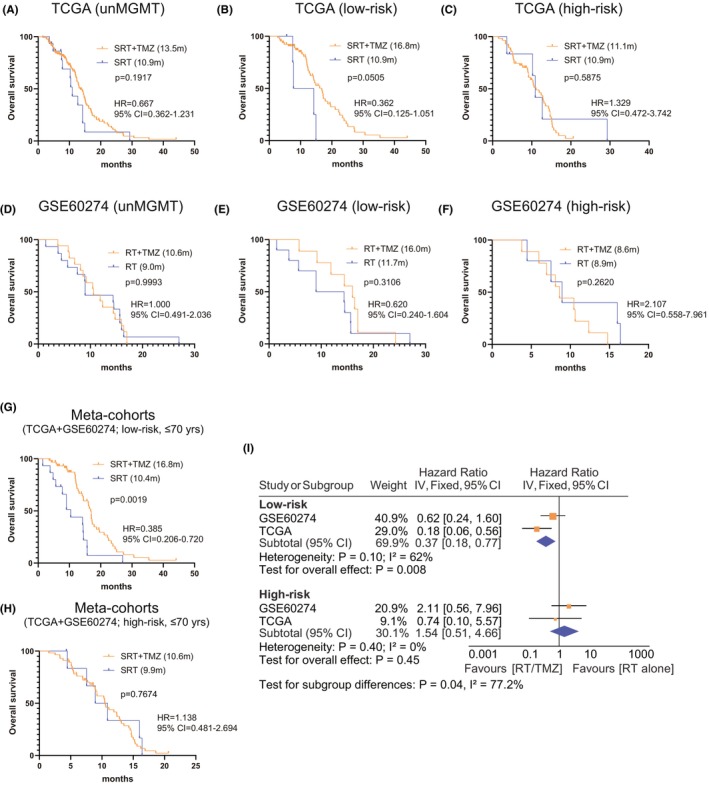
FIGURE 5.

The predictive performance of the 10‐CpG signature in G‐CIMP−/unMGMT GBMs; Survival difference between different treatments (SRT/TMZ vs. SRT) in G‐CIMP−/unMGMT GBMs from (A) TCGA and (D) GSE60274 cohort; Interaction analysis between treatments (SRT/TMZ vs. SRT alone), and risk subgroups (low‐risk vs. high‐risk) in (B,C) TCGA and (E,F) GSE60274 cohort. Pooled survival comparisons using patient‐level data between different treatments (SRT/TMZ vs. SRT) in (G) low‐risk and (H) high‐risk subgroups; Meta‐analysis using cohort‐level data between different treatments (SRT/TMZ vs. SRT) in each risk subgroup incorporating only younger patients (≤70 years). Survival difference of each treatment subgroup was tested by the log‐rank test with p value ≤0.05 as statistical significance. Hazard ratios [HR] from each dataset were combined by meta‐analysis, where the inverse‐variance approach was applied using either fixed‐ or random effect models based on the heterogeneity test, with I 2 ≥ 50% or p value ≤0.05 considered to be statistically significant.
