FIGURE 7.

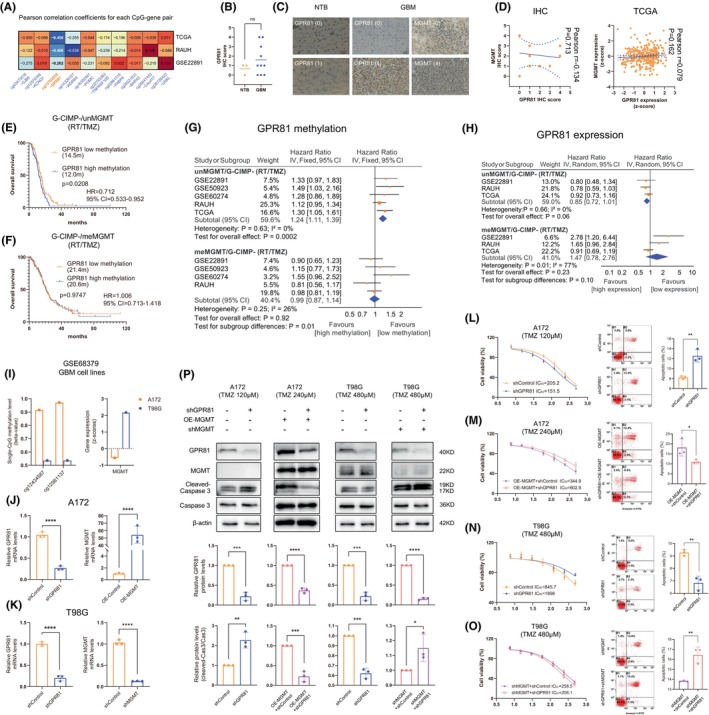
The impacts of GPR81 on TMZ resistance of GBM cells that may depend on MGMT status; (A) Pearson correlation coefficients for each CpG‐gene pair from included cohorts; (B). The IHC scores of GPR81 between NTB and GBM samples from Neurosurgery Department, Xijing Hospital; (C) Representative IHC images of GPR81 and MGMT in NTB or GBM samples, with corresponding IHC scores; (D) Pearson correlation between MGMT and GPR81 at protein and mRNA levels in local samples; (E,F) Survival difference between low versus high methylation of GPR81 among RT/TMZ‐treated (E) G‐CIMP−/unMGMT and (F) G‐CIMP−/meMGMT GBMs; the median methylation value (M‐value: 2.0708) from RT/TMZ‐treated G‐CIMP−/unMGMT GBMs was used for stratifying low versus high methylation; (G,H) Meta‐analyses for (G) GPR81 methylation‐based groups and (H) GRP81 expression‐based groups in RT/TMZ‐treated non‐G‐CIMP GBMs with each MGMT methylation status; the median expression value (Z‐score: −0.1992) from RT/TMZ‐treated G‐CIMP−/unMGMT GBMs was used for stratifying low versus high expression. (I) Methylation and expression status of MGMT in A172 and T98G cells from GSE68379; (J) Validation of GPR81 knockdown and MGMT overexpression in A172 cells by qRT‐PCR; (K) Validation of GPR81 knockdown and MGMT knockdown in T98G cells by qRT‐PCR; (L) GPR81 knockdown increased TMZ sensitivity and cell apoptosis to TMZ treatment in A172 cells originally with no detectable MGMT expression; (M) GPR81 knockdown decreased TMZ sensitivity and cell apoptosis to TMZ treatment in MGMT‐overexpressed A172 cells; (N) GPR81 knockdown decreased TMZ sensitivity and cell apoptosis to TMZ treatment in T98G cells originally expressing MGMT; (O) GPR81 knockdown increased TMZ sensitivity and cell apoptosis to TMZ treatment in MGMT‐silenced T98G cells; (P) Western bolt results in A172 and T98G cells treated with TMZ; Hazard ratios [HR] from each dataset were combined by meta‐analysis, where the inverse‐variance approach was applied using either fixed‐ or random effect models based on the heterogeneity test, with I 2 ≥ 50% or p value ≤0.05 considered to be statistically significant. All continuous data passed normality test except for IHC scores. Statistical significance was indicated at the level of ns >0.05, * < 0.05, ** <0.01, *** < 0.001 and **** < 0.0001. ns, non‐significant.
