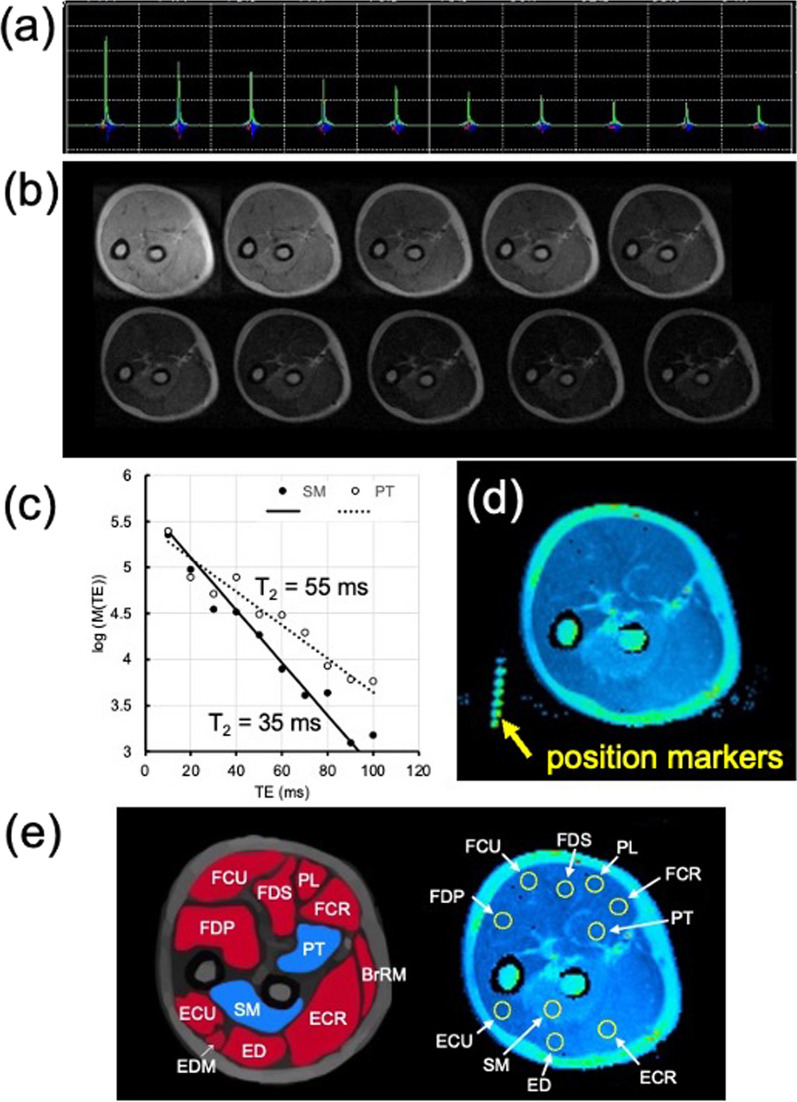
Fig. 2.
T2-map MRI. a Ten spin-echo signals at echo-time (TE) from 10 to 100 ms with a 10 ms step of the transverse MRI of the forearm. b T2-weighted MRI of the transverse slice of the forearm at TE from 10 to 100 ms with a 10 ms step shown from the upper-left to the lower-right. c Results of the nonlinear fitting image intensity of the pronator teres (PT: open circle) and supinator (SM: closed circle) after the supination exercise to a function of M(TE) = Mo exp(− TE/T2), where M(TE) and Mo are image intensities at a given TE and at TE = 0, respectively. In order to present the single exponential decay, the T2 relaxation decay was presented using a semilogarithmic scale. d Typical T2 maps of muscles after supination exercise. MR position markers are also presented. e Muscle traces in the transverse MRI of the forearm, and the T2-map MRI with ROI positions for 10 muscles. The abbreviations employed are shown in Table 1a

