Fig. 2.
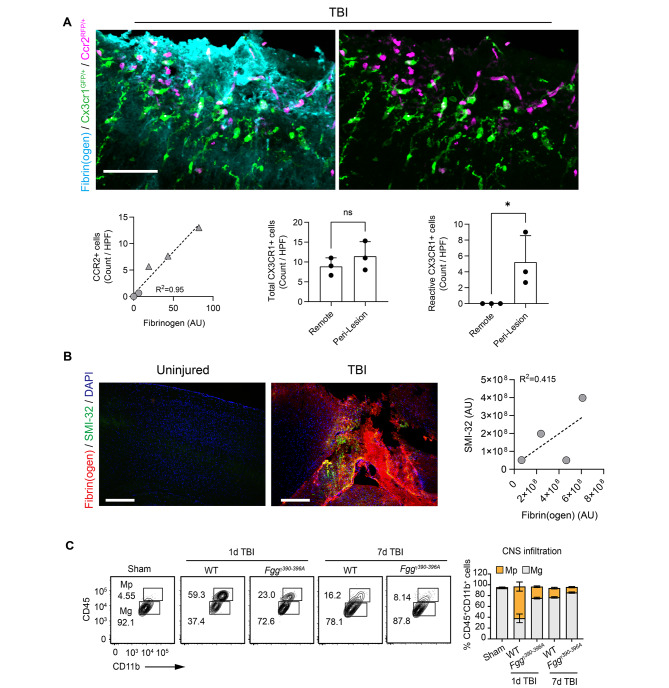
Fibrin regulates microglia activation and myeloid cell infiltration in TBI. (A) (Top) Superimposed images of cortex from a Cx3cr1GFP/+Ccr2RFP/+ mouse at 2 days post-injury, stained for fibrin(ogen) (cyan), with amoeboid, “reactive” GFP+ microglia (green) and RFP+-expressing macrophages (magenta). Scale bar, 50 μm. (Below, left) Quantification of fibrin(ogen) staining intensity (X-axis) with the number of CCR2+ cells per field. Three peri-lesional regions of interest (triangles) and three remote regions 300 μm from the lesion site (circles) were analyzed per mouse (n = 3 mice; linear regression with goodness of fit). Each symbol represents the data for an individual mouse. (below, mid and right) Quantification of total and amoeboid CX3CR1+ cells in regions of interest that were lesional or peri-lesional areas from injury 1 day after CCI. Data from n = 3 mice (mean ± s.e.m.). HPF, high-power field. ns, not significant. *P < 0.05 by two-tailed Mann-Whitney test. (B) Confocal images from mouse cortex 2-days post-CCI, stained for fibrin(ogen) (red), SMI-32 (green), and DAPI (blue). Scale bar, 400 μm. (Right) Scatter plot of fibrin(ogen) (X-axis) and SMI-32 (Y-axis) intensities (n = 4 mice; linear regression with goodness of fit). Each circle represents the data for an individual mouse. AU, arbitrary units. (C) Representative flow cytometry contour plots of microglia (CD45loCD11b+; Mg) and infiltrated myeloid cells (CD45hiCD11b+; Mp) in brains of TBI 1d and 7d after injury or sham mice. Flow cytometry cell quantification is shown. Data are presented as mean ± s.e.m.; n = 5 mice (sham), 4 mice (1d TBI WT), 4 mice (1d TBI Fggγ390–396A), 3 mice (7d TBI WT), and 3 mice (7d TBI Fggγ390–396A)

