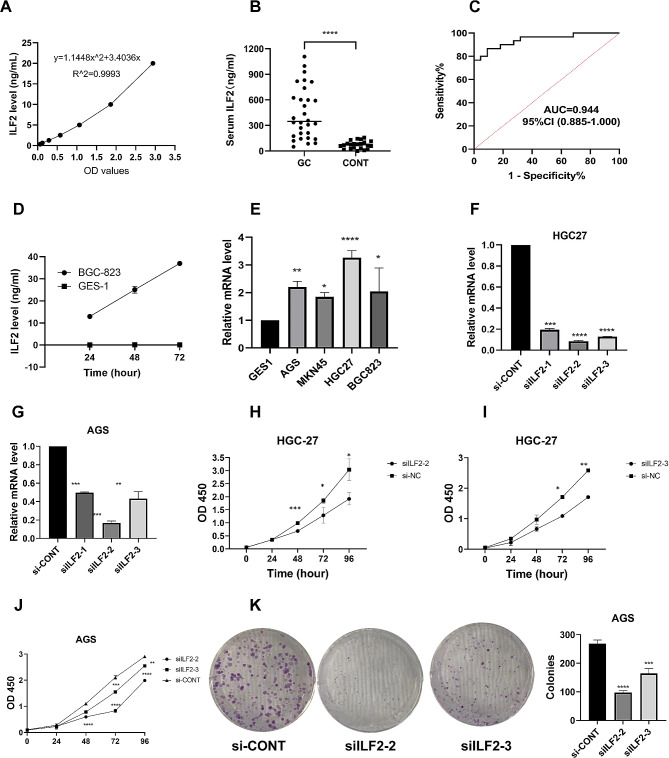
Fig. 5.
Clinical and functional validation of ILF2. A: The standard curve for the detection of ILF2 by enzyme-linked immunosorbent assay. B: Serum ILF2 levels and comparison between gastric cancer and control group. C: The receiver operating characteristic curve of serum ILF2 levels for the diagnosis of gastric cancer. D: ILF2 levels in cell culture supernatants. E: Relative mRNA expression levels of ILF2 in different gastric cancer cell lines; F, G: The effect of siRNA-mediated ILF2 knockdown on mRNA expression in HGC-27 and AGS cells; H-J: Comparisons of HGC-27 cell proliferation between siRNA-mediated ILF2 knockdown and control groups. K: The effect of siRNA-mediated ILF2 knockdown on clone formation in AGS cells. AUC, Area Under Curve; CI, Confidence Interval; OD, Optical Density

