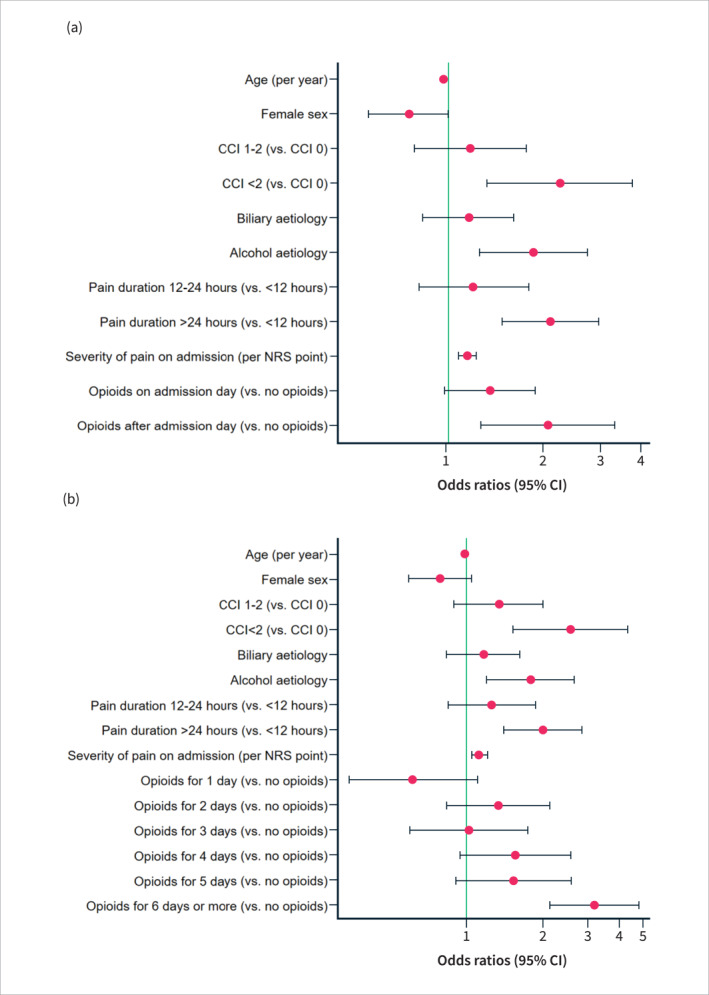
FIGURE 4.

Forest plot illustrating the odds ratios for the risk of developing moderately severe or severe acute pancreatitis (AP) based on the timing of opioid administration (a) and the duration of opioid treatment (b) (multivariate analyses). CCI, Charlson Comorbidity Index; NRS, Numeric Rating Scale; CI, confidence interval.
