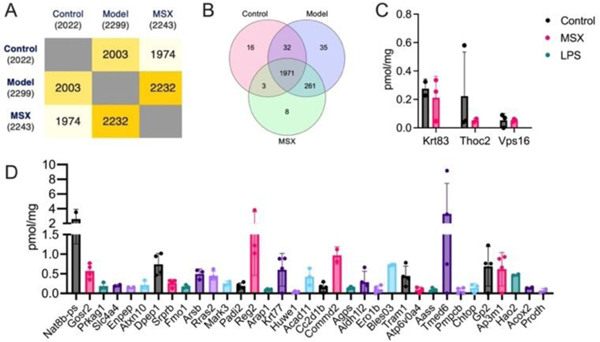
Figure 2.
Comparative analysis of spleen protein expression profiles across three experimental groups. (A) Quantification of identified proteins within each experimental group. (B) Venn diagram illustrating the shared and distinct protein sets among the control, model (LPS-induced), and MSX-treated groups. (C) Identification of unique proteins exclusively expressed in the control and MSX-treated groups. (D) Identification of unique proteins exclusively expressed in the model (LPS-induced) group. Four biological samples per group were employed. If a protein cannot be detected in one group in at least two of the biological samples, it will be considered a missing value.

