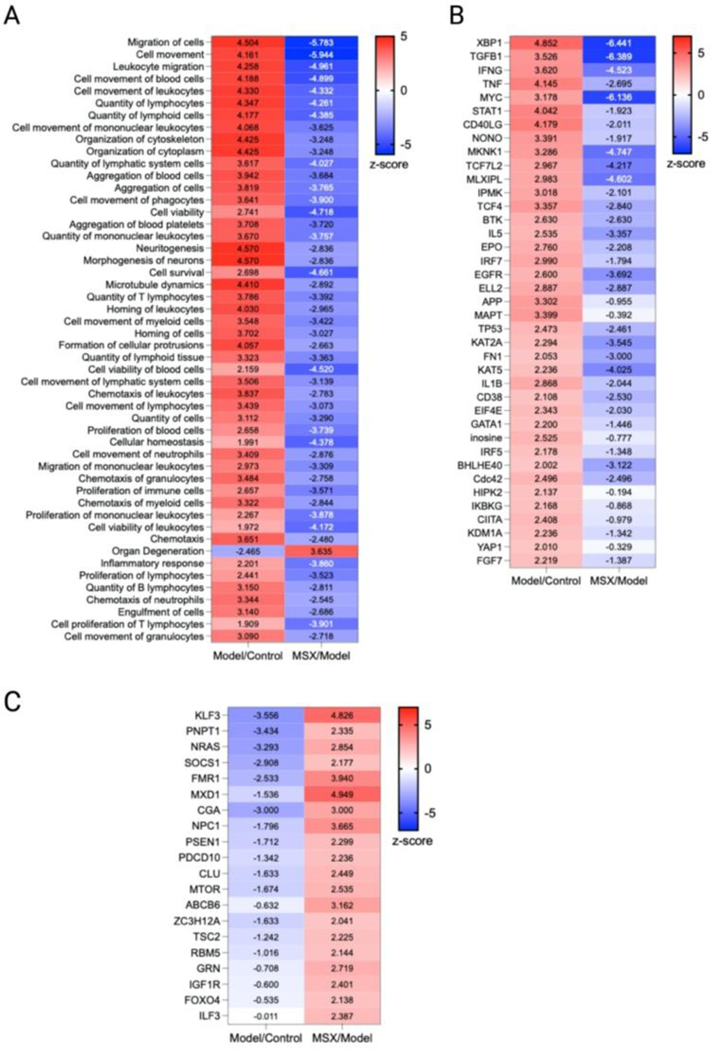
Figure 5.
Comparative analysis of diseases, functions, and upstream regulators across all groups. To discern significant differences among the groups, a comparative analysis was conducted using a threshold of -log(p-value) > 1.3. The heatmap depicts the results of this analysis, with numerical values representing the corresponding z-scores. (A) Selection of the top 50 diseases and functions from a pool of 708 available options. (B) Identification of upstream regulators activated by LPS, as evidenced by a z-score > 2 in the Model/Control group and a z-score < 0 in the MSX/Model group, thereby indicating their suppression by MSX. (C) Identification of upstream regulators suppressed by LPS, as indicated by a z-score < 0 in the Model/Control group and a z-score > 2 in the MSX/Model group, suggesting their restoration by MSX treatment.

