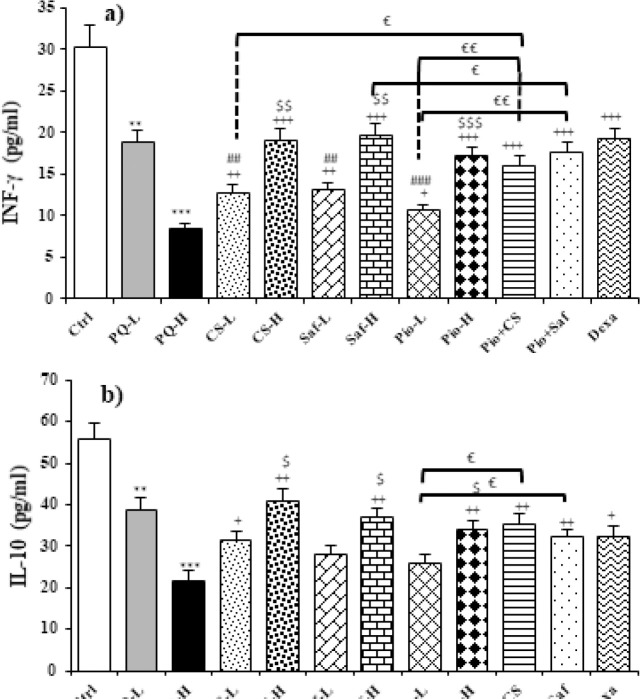
Figure 6.
Serum levels of INF-γ (a), IL-10 (b), and TNF-α (c), in different studied groups
The results are expressed as mean ± SEM (n = 7 in each group). * P<0.05, ** P<0.01 and *** P<0.001compared to the control group. + P<0.05, ++ P<0.01 and +++ P<0.001 compared to the PQ group. # P<0.05, ## P<0.01 and ### P<0.001 compared to dexamethasone treated group. € P<0.05, €€ P<0.01 and €€€ P<0.001 compared to combination treated groups. $P<0.05, $$ P<0.01 and $$ P<0.01 compared to group low doses of pioglitazone and the extract, safranal. Comparisons between different groups were made using one-way ANOVA followed by Tukey’s multiple comparison test. Ctrl, control group, PQ-L and PQ-H, groups exposed to paraquat aerosol with dose of 27, 54 mg/m3, CS-20,80 mg/kg/day, , CS-L, DS-H, Saf-L, Saf-H, Pio-L, Pio-H, Pio + CS-, Pio + Saf and Dexa are groups exposed to PQ-H and treated with 20 and 80 mg/kg/day extract, 0.8 and 3.2 mg/kg/day safranal, 5 and 10 mg/kg/day pioglitazone, Pio,5 + CS, 20 mg/kg/day, Pio, 5 + Saf, 0.8 mg/kg/day and 0.03 mg/kg/day dexamethasone, respectively.

