
Fig. 7:
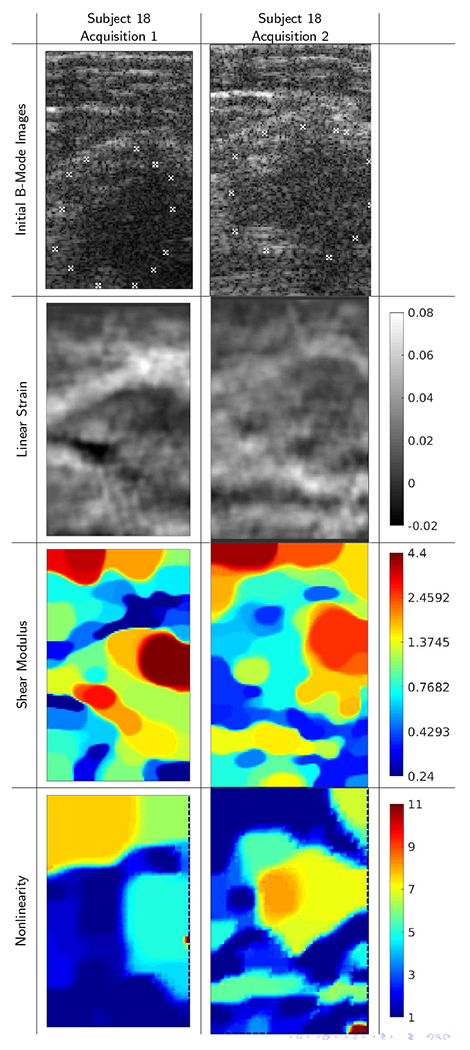
B-mode images, strain images, linear elastic shear modulus images, and elastic nonlinearity parameter images for repeat acquisitions of subject 18 showing exceptionally poor agreement between the acquisitions. In this example, the original ROI was poorly targeted in the repeat acquisition, and so all four image types show large differences. Correlations between repeat acquisitions are 0.704, 0.259, 0.415, −0.155, between repeated acquisition of B-mode images, strain images, shear modulus images, and elastic nonlinearity parameter images. We note in particular that the nonlinearity maps are negatively correlated.