
Figure 2.
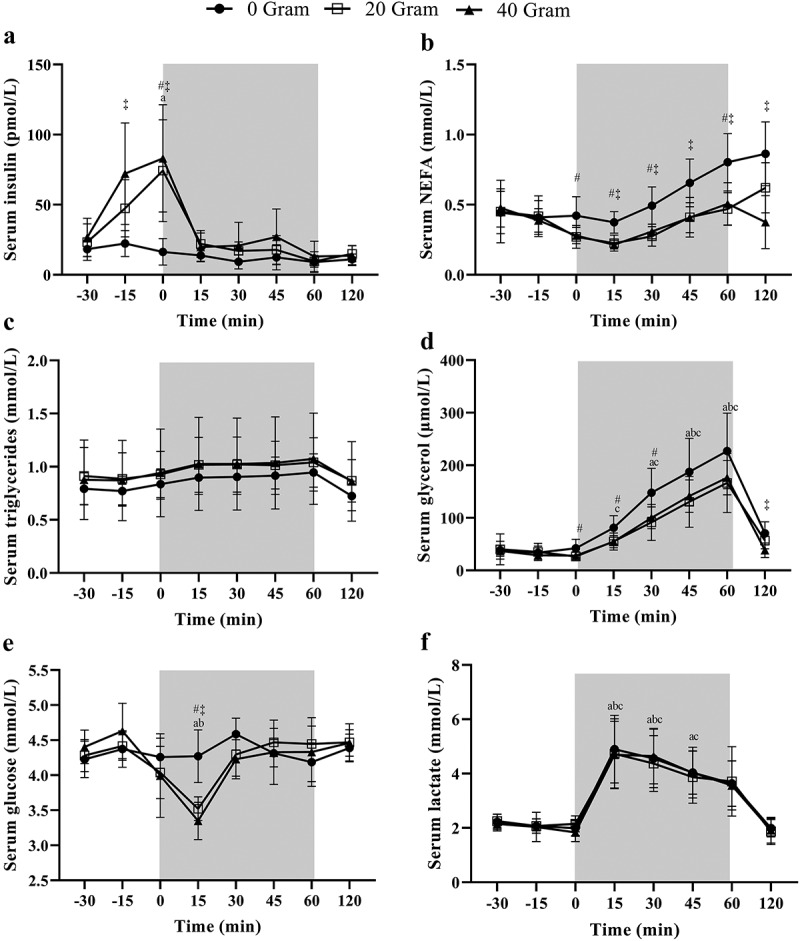
Serum (a) insulin, (b) non-esterified fatty acids (NEFA), (c) triglycerides, (d) glycerol, (e) glucose and (f) lactate concentrations following the consumption of either 0, 20, or 40 g of whey protein hydrolysate thirty minutes prior to 1 h of cycling exercise at 60% of peak power output (N = 9). Data are mean ± standard deviation. The grey area indicates the exercising window. a, b and c indicate a significant difference for 40, 20, or 0 g protein respectively compared to the fasted baseline sample (t = −30 min; p < 0.05). # and ‡ denote a significant difference (p < 0.05) between 0 vs. 20 or 0 vs. 40 g, respectively, at the indicated time point.