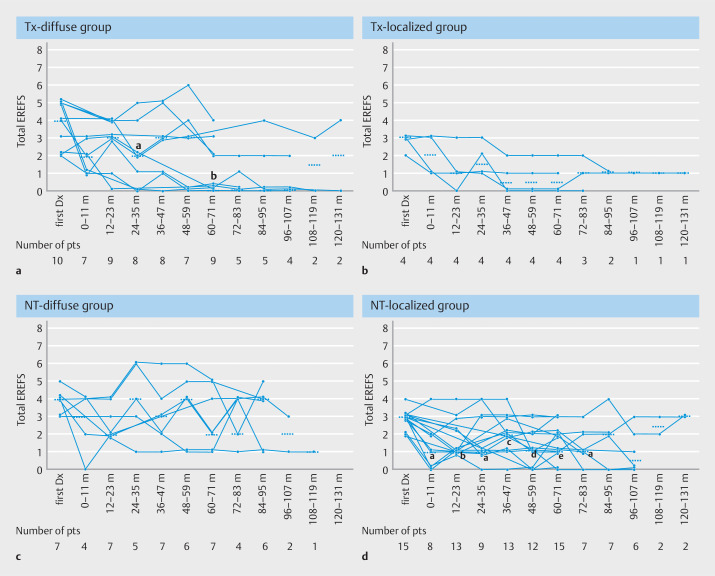
Fig. 4.
Line graph showing the annual chronological change in the total EREFS from the first diagnosis to the last follow-up. The number of patients who underwent endoscopy at each follow-up period is shown at the bottom of the figure. The horizontal short dotted line represents the median value of the total EREFS at each follow-up period. EREFS, EoE endoscopic reference score; m, month; pts, patients; Dx, diagnosis; PPI, proton pump inhibitor; PCAB, potassium competitive acid blocker; aEE, asymptomatic esophageal eosinophilia; mEoE, minimally symptomatic EoE. a Tx-diffuse group, which includes patients with diffuse-type EoE who continuously received PPI/PCAB. a, P = 0.0313; b, P = 0.0078 (vs. at the first diagnosis). b Tx-localized group, which consists of patients with localized-type EoE who continuously received PPI/PCAB. c NT-diffuse group, which consists of patients with diffuse-type aEE or mEoE who were continuously untreated. d NT-localized group, which consisted of patients with localized-type aEE or mEoE who are continuously untreated. a, P =0.0313; b, P =0.0034; c, P =0.0137; d, P =0.0039; e, P =0.0010 (vs. at the first diagnosis).

