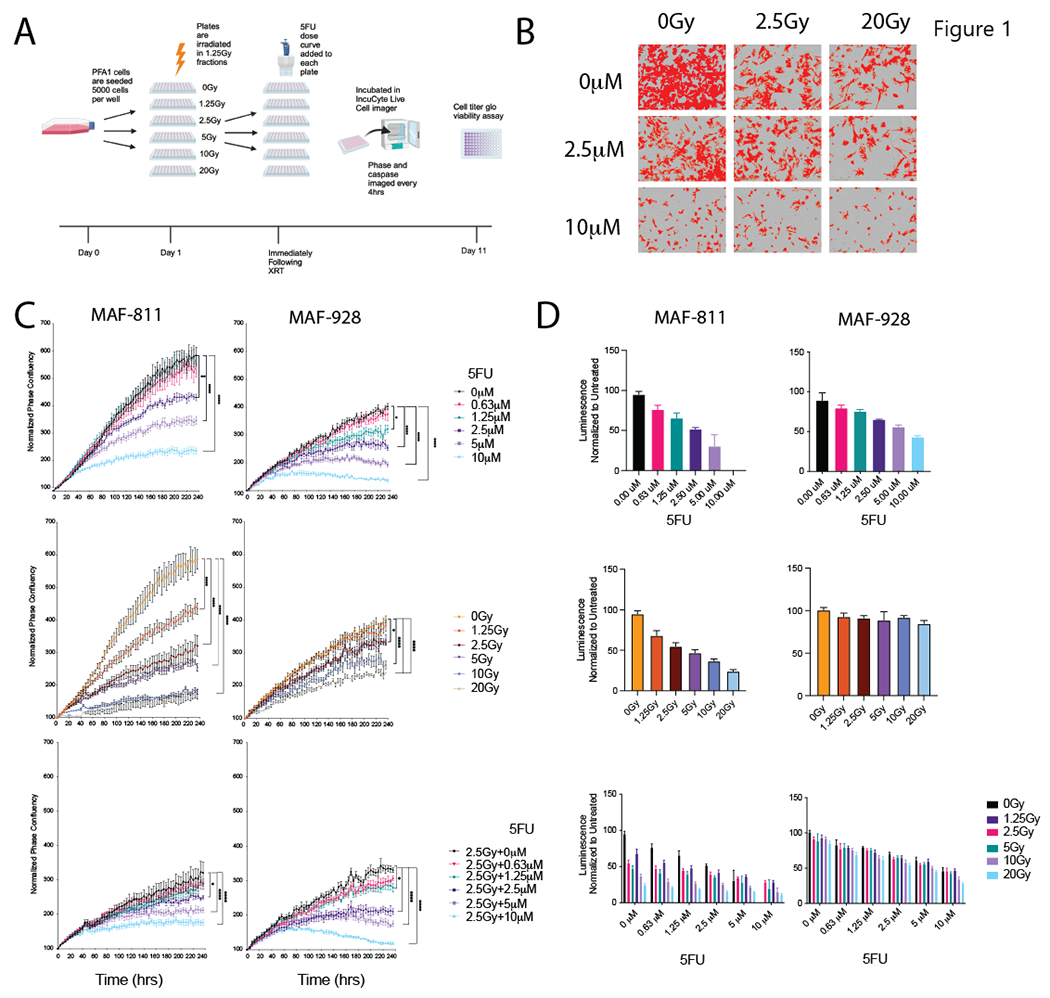
Figure 1. In vitro evaluation of combination 5FU and radiation in 1q+ PFA cell lines.

A. Schematic of timing and order of treatments for in vitro studies. Graphic made using BioRender. B. Representative phase contrast images from IncuCyte live-cell imager with confluence mask overlay (red). C. Proliferation curves following treatment with 5FU alone (top), radiation alone (middle) and combination 2.5Gy and 5FU (bottom) Data represented as normalized phase confluency. * Denotes p-value<0.05, **** denotes p-value<0.0001. D. Viability assays measured by Cell Titer Glo after 10 days of treatment with 5FU alone (top), radiation alone (middle) and combination (bottom). Data is represented as normalized luminescence to the untreated controls.
