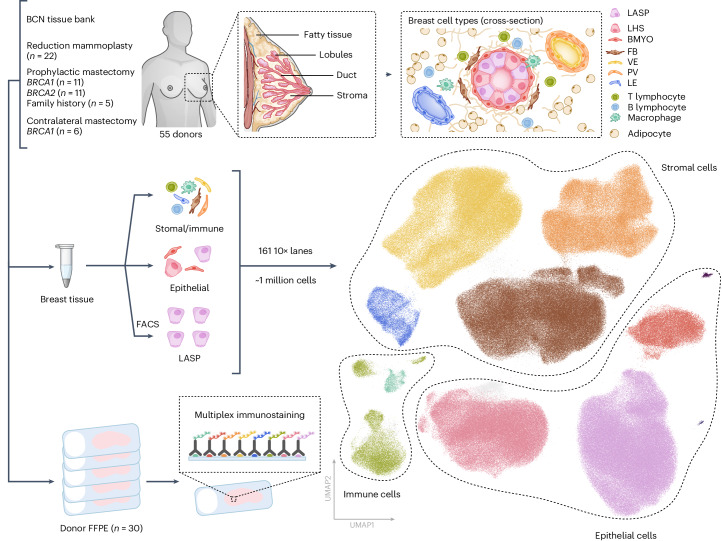
Fig. 1. Overview of the HBCA.
A schematic highlighting the overall experimental design and the cell types we aimed to capture in the atlas. The diagram highlights the overall number of donors sequenced and how they are distributed among the various subgroups alongside the number of donor FFPE tissues that have been analyzed by multiplex immunostaining. The global UMAP representation of the final dataset is colored by general cell types captured from all 161 samples processed as part of this atlas.

