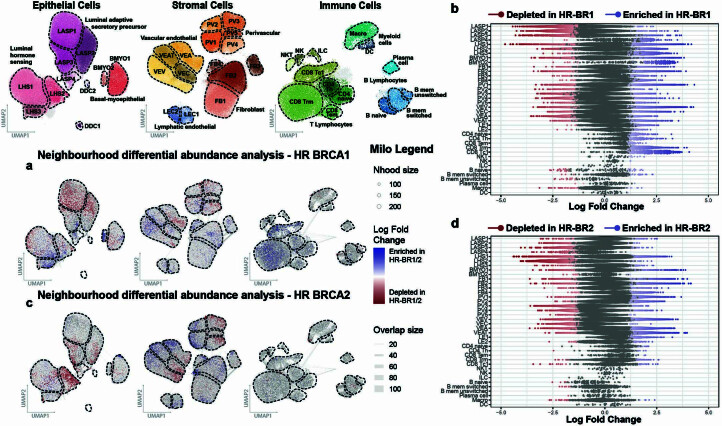
Extended Data Fig. 5. Impact of BRCA1 and BRCA2 germline mutations on the cellular composition of the breast.
(a) Milo cell neighbourhood differential abundance plots of the significant (FDR < 0.05) changes in the breast composition comparing average risk (AR) donors (n = 22) to the high risk BRCA1 germline (HR-BR1) cohort (n = 11), blocking for the effects of age and parity. Blue represents enrichment with HR-BR1, whilst red denotes depletion with HR-BR1. (b) Beeswarm plot of the log fold changes of the Milo neighbourhoods grouped into each cell type subcluster for AR versus HR-BR1. Neighbourhoods with a significant change in cellular abundance are coloured as indicated. (c) Milo cell neighbourhood differential abundance plots of the significant (FDR < 0.05) changes in the breast composition comparing AR donors (n = 22) to the high risk BRCA2 germline (HR-BR2) cohort (n = 11), blocking for the effects of age and parity. Blue represents enrichment with HR-BR2, whilst red denotes depletion with HR-BR2. (d) Beeswarm plot of the log fold changes of the Milo neighbourhoods grouped into each cell type subcluster for AR versus HR-BR2. Neighbourhoods with a significant change in cellular abundance are coloured as indicated.

