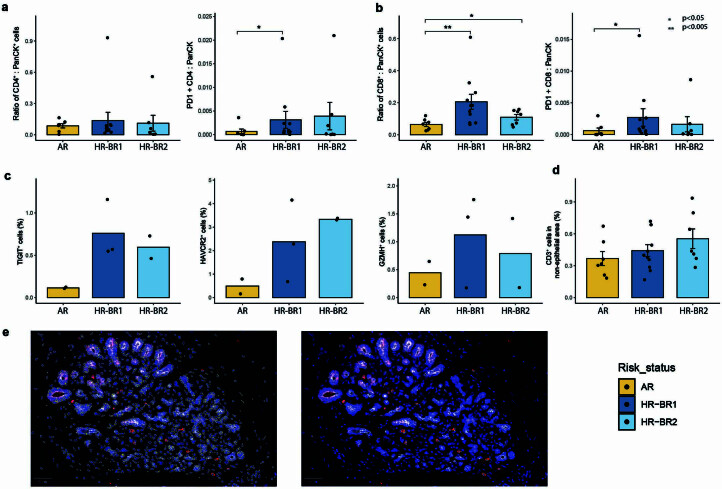
Extended Data Fig. 9. Quantification of Ultivue and Immunofluorescence images.
(a) Bar plots showing the ratio of CD4+ (left) and CD4+/PD1+ double-positive (right) cells to PanCK+ cells in whole Ultivue tissue slides from average risk (AR; n = 10), high-risk BRCA1(HR-BR1; n = 11, p=) and high-risk BRCA2 (HR-BR2; n = 8) donors. The p-values are calculated with one-way non-parametric Wilcox test with * (**) indicating p < 0.05 (p < 0.005) respectively. The AR vs HR-BR1 (CD4+PD1 : PanCK) comparison has p = 0.028. Error bars show the standard error of the mean. (b) Bar plots showing the ratio of CD8+ (left) and CD8+/PD1+ double-positive (right) cells to PanCK+ cells in whole Ultivue tissue slides from average risk (AR; n = 10), high-risk BRCA1(HR-BR1; n = 11) and high-risk BRCA2 (HR-BR2; n = 8) donors. The p-values are calculated with one-way non-parametric Wilcox test with * (**) indicating p < 0.05 (p < 0.005) respectively. The AR vs HR-BR1 (CD8 : PanCK) comparison has p = 0.0041, AR vs HR-BR2 (CD8 : PanCK) comparison has p = 0.049 and AR vs HR-BR1 (CD8+PD1 : PanCK) comparison has p = 0.028. Error bars show the standard error of the mean. (c) Bar plots showing the percentage of TIGIT+ (left), HAVCR2+ (middle) and GZMH+ (right) cells from the immunofluorescence images (n = 2 for AR and HR-BR2, n = 3 for HR-BR1) shown in Fig. 5 and Supplementary Figs. 19–22. (d) Bar plot showing the percentage of CD3+ cells located in non-epithelial epithelial areas (ie. not intercalated with the epithelium) in HR-BR1 (n = 11) and HR-BR2 (n = 8) donors compared to AR (n = 10) donors in whole Ultivue slides (see Methods). No significant differences were found with one-way non-parametric Wilcox test. Error bars show the standard error of the mean. (e) Example segmentation and calling of positive cells of an immunofluorescence (GZMH) image (AR n = 2, HR-BR1 n = 3, HR-BR2 n = 2).

