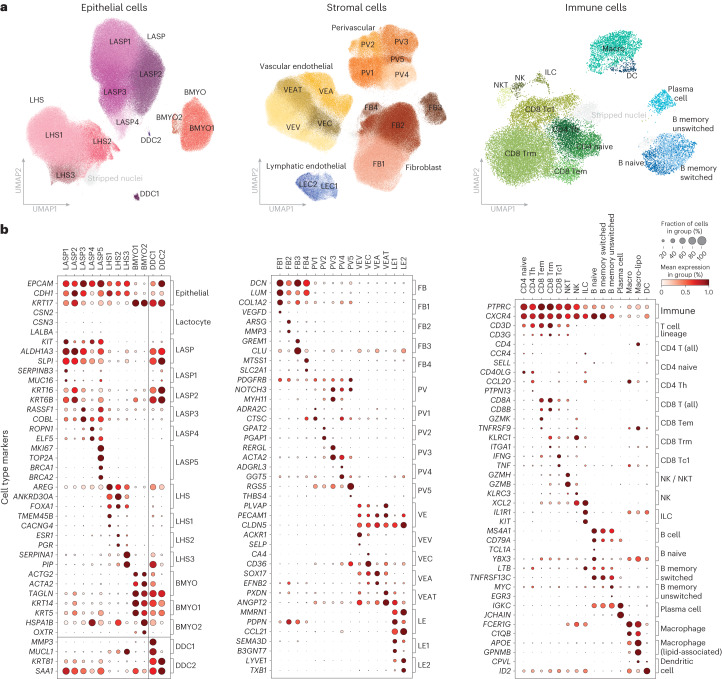
Fig. 2. Major cellular groups identified in the HBCA.
a, UMAP plots of the epithelial, stromal and immune cell compartments colored and labeled by subcluster annotations. Doublets/stripped nuclei are plotted in gray. b, Dot plots summarizing the known markers used to identify cell types and a selection of genes distinguishing each subcluster for the epithelial (left), stromal (middle) and immune (right) compartments. Each column corresponds to a specific cell subcluster and the rows correspond to a list of key marker genes (expression normalized per gene), brackets on the right side of each plot detail the cell type or subcluster that these genes mark.

