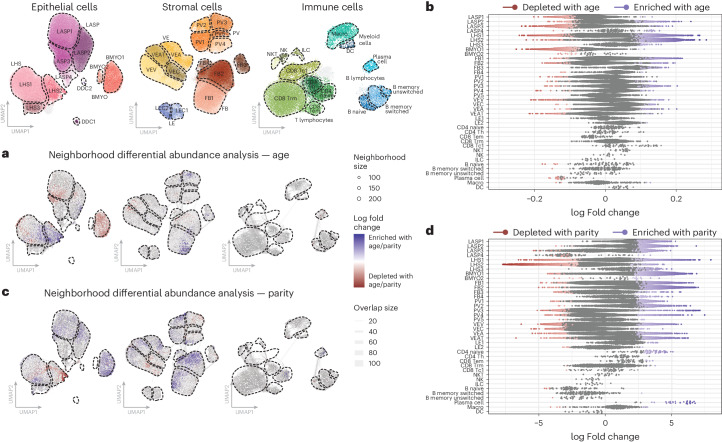
Fig. 3. Age and parity affect the homeostatic cellular state of the breast.
a, Milo cell neighborhood differential abundance plots of the significant (FDR <0.05) changes in the breast composition with age, blocking for the effects of parity (mammoplasty donors; n = 22). We test the effects of age as a continuous scale ranging from 19 to 65 years, with the color gradient scale representing log fold changes per year. Blue represents enrichment with age while red denotes depletion with age. b, Beeswarm plot of the log fold changes in the Milo neighborhoods with age, grouped into each cell-type subcluster. Neighborhoods with a significant change in cellular abundance are colored as indicated. Log fold changes are per year due to the continuous age scale tested. c, Milo cellular neighborhood differential abundance plots of the significant (FDR <0.05) changes in the breast composition with parity (that is, nulliparous versus parous), blocking for the effects of ageing (mammoplasty donors; n = 22). Blue represents enrichment with parity while red denotes depletion with parity. d, Beeswarm plot of the log fold changes of the Milo neighborhoods with parity, grouped into each cell-type subcluster. Neighborhoods with a significant change in cellular abundance are colored as indicated.

