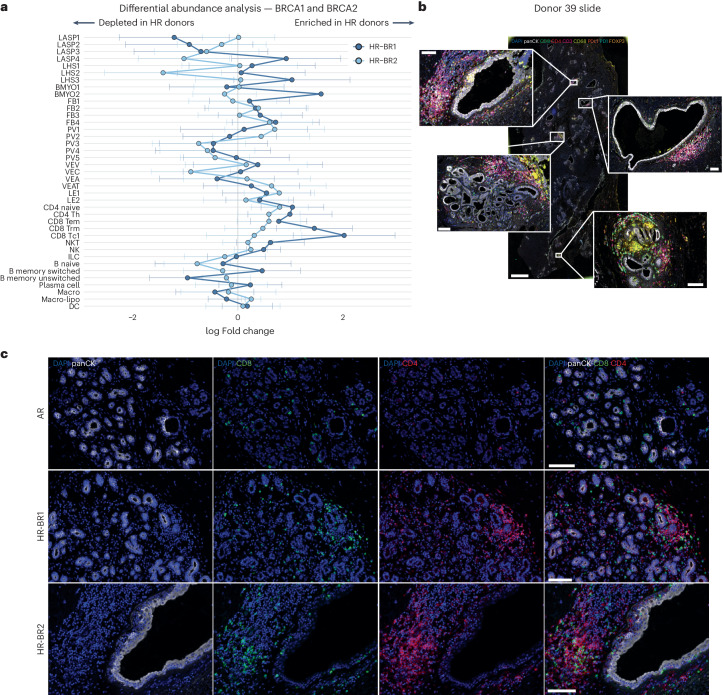
Fig. 4. HR-BR1 and HR-BR2 germline mutations associated with increased proportions of immune cells in the breast.
a, Summary plot of average Milo differential abundance results comparing the cellular composition of the breast from AR donors against HR-BR1 and HR-BR2 donors, blocking for the effects of both age and parity. To enable fair comparisons, neighborhoods were computed to be shared by AR/HR-BR1 and AR/HR-BR2 tests. The plot summarizes the mean and variance of log fold changes for each cell subcluster in both the HR-BR1 and HR-BR2 cohorts. A zero log fold change represents the same subcluster proportions as AR donor tissue on average, while positive (negative) log fold changes denote subcluster enrichment (depletion) in the relative HR donor breast. See Extended Data Fig. 5 for full Milo results in HR comparisons. b, Example of whole section output using the Ultivue staining technology. DAPI, panCK, CD8, CD4, CD3, CD68, PDL1, PD1 and FOXP3 staining with colors indicated in figure are shown on a whole section and magnified insets from a representative donor. Scale bars, 100 µm in the insets, 2 mm in the whole section image. c, Ultivue staining showing panCK (white), CD8 (green), CD4 (red) and DAPI (blue) of breast sections from representative AR (n = 10), HR-BR1 (n = 11) and HR-BR2 (n = 8) donors as indicated. Scale bars, 100 µm.

