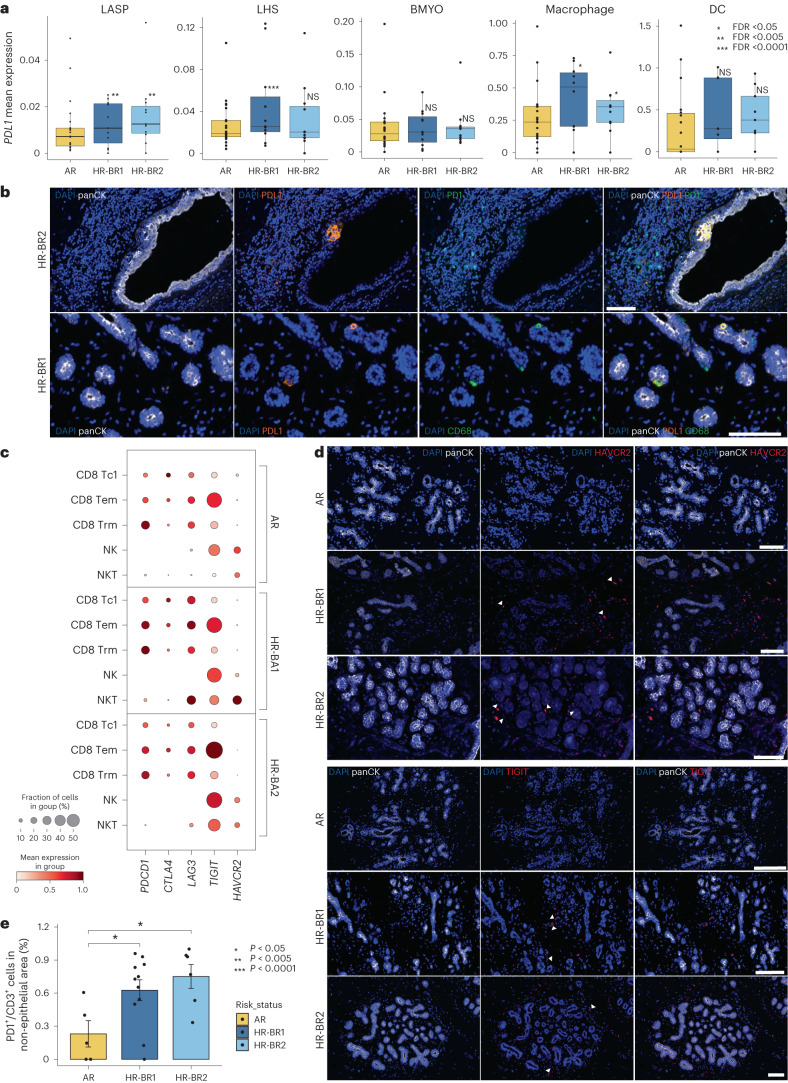
Fig. 5. HR-BR1 and HR-BR2 donor breast tissue display increased expression of immune checkpoint inhibition and exhaustion markers.
a, Boxplots visualizing the change in mean expression (log-transformed counts) for immune checkpoint ligand PDL1, identified as significantly upregulated in HR-BR1 (LASP, LHS and macrophage) and HR-BR2 (LASP and macrophage) donors with respect to AR controls. FDR values derived from edgeR pseudobulk differential gene expression testing for AR versus HR-BR1 and AR versus HR-BR2 (n = 33 in both comparisons; see Methods and Extended Data Fig. 4 for more details). The boxplot centers show median values while the minima/maxima show the 25th/75th percentiles, respectively, and whiskers extend to the most extreme datapoint within 1.5× interquartile range of the outer hinge of the boxplot. b, Top: Ultivue staining showing panCK (white), PDL1 (orange), PD1 (green) and DAPI (blue) of a breast section from an HR donor showing an example of epithelial expression of PDL1. Bottom: Ultivue staining showing panCK (white), PDL1 (orange), CD68 (green) and DAPI (blue) of a breast section from an HR donor showing examples of CD68 cells expressing PDL1. Scale bars, 100 µm. c, Dot plot displaying the expression of several key immune checkpoint receptors expression in a range of cytotoxic lymphoid subclusters comparing between AR, HR-BR1 and HR-BR2 donor groups. Expression is normalized per gene. d, Top: immunofluorescence staining showing panCK (white), HAVCR2 (red) and DAPI (blue) of representative breast sections from AR and HR donors. Bottom: immunofluorescence staining showing panCK (white), TIGIT (red) and DAPI (blue) of a representative breast section from AR and HR donors. Arrowheads point at examples of positive cells. Each staining is representative of two (AR, HR-BR2) or three (HR-BR1) donor samples. Scale bars, 100 µm. e, Bar plot showing the percentage of PD1+/CD3+ double-positive cells located in non-epithelial epithelial areas (that is not intercalated with the epithelium) in HR-BR1/2 donor compared with AR donors in whole Ultivue slides (Methods). The P values are calculated with one-way non-parametric Wilcoxon tests for both AR versus HR-BR1 (n = 21, P = 0.02) and AR versus HR-BR2 (n = 18, P = 0.018) comparisons. Error bars show the standard error of the mean.

