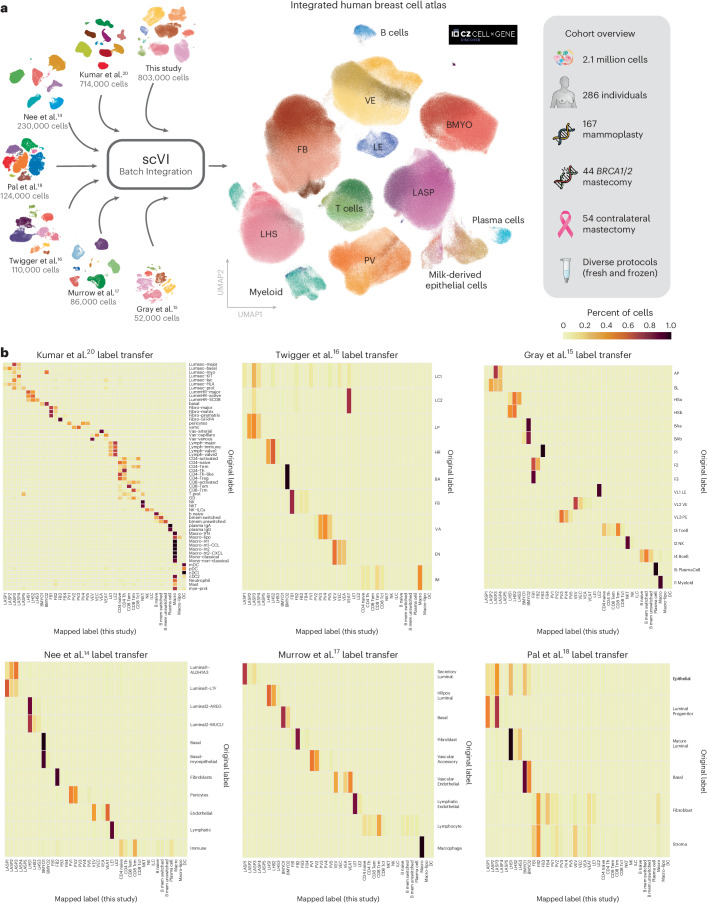
Fig. 6. The iHBCA provides quantitative comparison of cell-type annotations across seven of the largest scRNA-seq datasets for the breast.
a, A schematic showing the curation of the iHBCA combining seven of the largest scRNA sequencing datasets for the breast. The diagram highlights the composition and sample heterogeneity captured by the iHBCA. The central plot shows a global UMAP representation of the dataset colored by transferred subcluster annotations (Fig. 2) from the HBCA. Annotation labels were mapped using CellTypist logistic regression models (Methods). b, A set of six confusion matrices showing the cell type/subcluster comparisons between each of the published datasets and our own subcluster annotations. Each cell (row A, column B) shows the percentage of cells of type A in the original dataset that are mapped to cell type B in our HBCA subcluster annotations. Note: LC1/2 cells from the Twigger dataset are cells thought to appear only in the lactating gland and are hence absent from the HBCA cohort causing their nonsensical logistic regression mapping.

