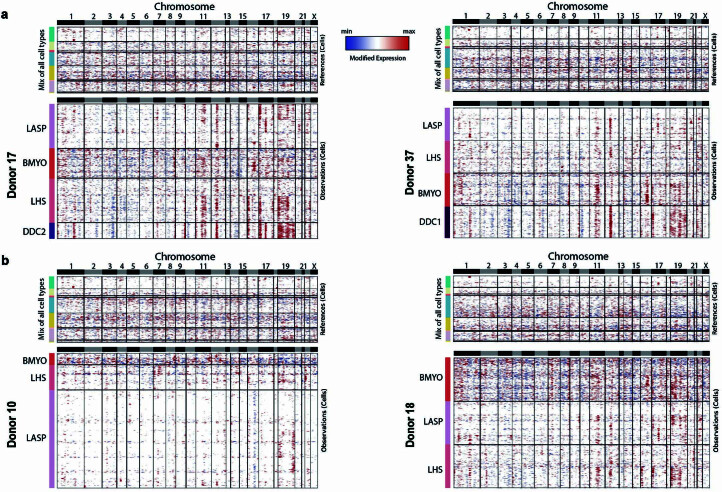
Extended Data Fig. 3. InferCNV predicts putative CNV profiles in the DDC1/2 clusters.
(a) Denoised inferCNV output plot predicting copy number variation (CNV) profiles per cell over the epithelium of Donors 17 (left) and 37 (right), both containing the unique donor derived clusters (DDCs). Red (blue) indicates increased (decreased) expression in the respective genomic region. For each inferCNV test, a reference dataset of cells sampled from mammoplasty donors (excluding those tested) plus the remaining stroma/immune cells of the tested donor, were used to account for any cell type or donor specific expression profiles across the genome. (b) Similar analysis as above but for two randomly selected control mammoplasty donors.

