Fig. 2.
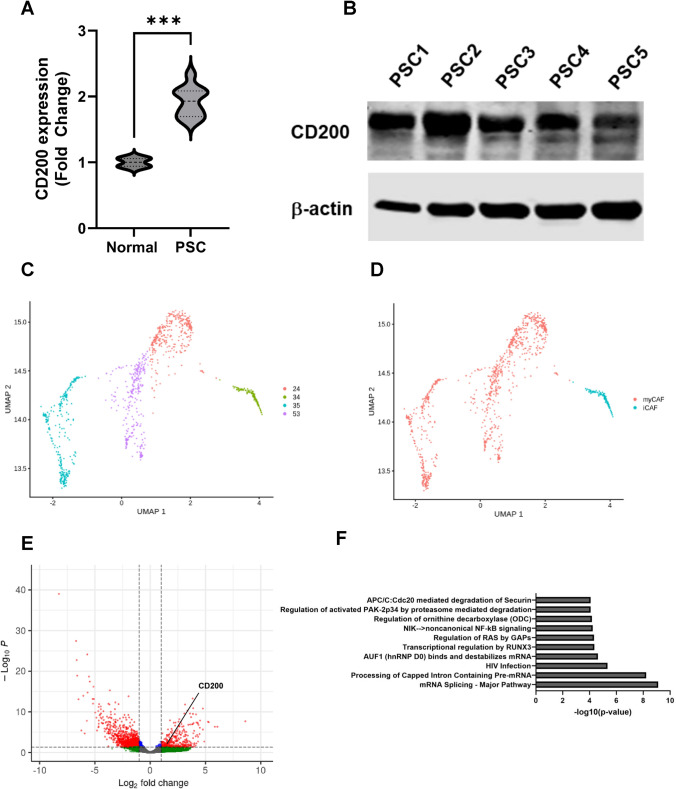
CD200 expression is upregulated on iCAFs. A CD200 mRNA expression from PDAC patient PSCs compared to normal HPPFC controls via Nanostring analysis. B Western Plot showing CD200 expression in PDAC patient PSCs. C UMAP of CAF clusters from single-cell RNA-sequencing dataset of PDAC patients from NIH dbGaP and D identification of clusters as myCAFs and iCAFs. E Volcano-plot showing significantly upregulated and downregulated genes in iCAFs. F Top 10 pathways significantly affected in iCAFs via Reactome analysis. *** = p < 0.001

