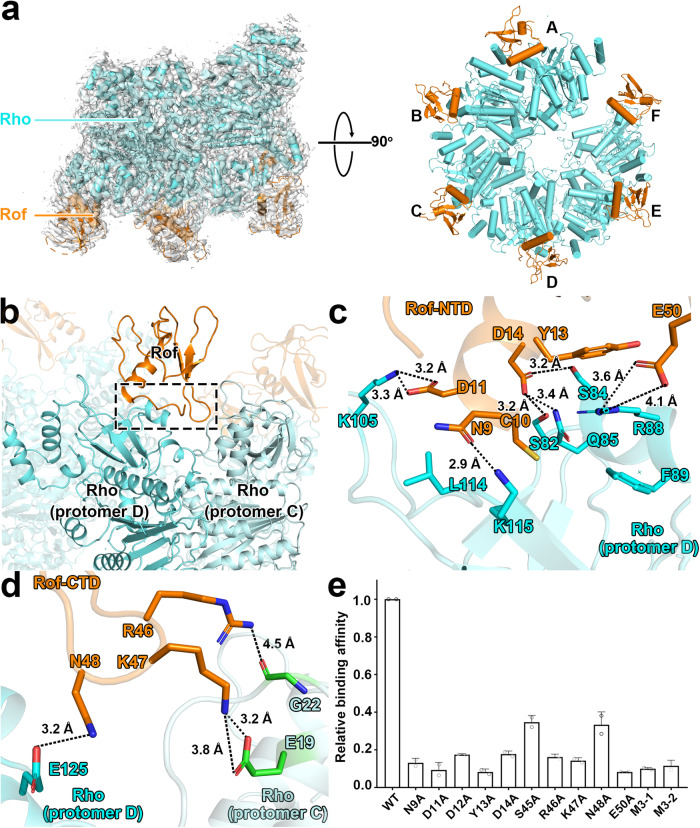
Fig. 1. Structure of the Rho-Rof antitermination complex.
a Cryo-EM structure of the Rof-Rho complex. Left panels, view orientation having the Rho hexamer central channel aligned with the y axis, showing the open-ring gap between Rho protomer A and protomer F. Right panels, orthogonal view orientation showing interactions of Rof with Rho protomers A-F. Images show EM density (gray surface) and fit (ribbons) for Rho. Rho and Rof are in cyan and orange. b Rho-Rof interactions in Rho-Rof antitermination complex. Overall interactions, focusing on Rof binding with Rho protomer D and C. The interface is highlighted by the dashed black box. Rof, Rho (protomer D) and Rho (protomer C) are in orange, cyan, and light cyan. Other parts of the complex are shown in transparent color. c Details of interactions for Rof-NTD and Rho protomer D. Rof residues that interact with Rho are labeled and shown as orange sticks, Rho protomer D residues involving the interactions are shown as cyan sticks. Black dashed lines indicate hydrogen bonds and salt bridges. d Details of interactions for Rof-CTD and Rho protomer D and C. Rho protomer C residues involving the interactions are shown as green sticks. Other colors and labels are as Fig. 1c. e Substitution of Rof residues involved in interactions with Rho decreased their in vitro binding affinity. Data for Biacore experiments are means of three technical replicates. Error bars represent ± SEM of n = 2 experiments. M3-1 represents N9A/D11A/D12A triple mutations, M3-2 represents R46A/K47A/N48A triple mutations.

