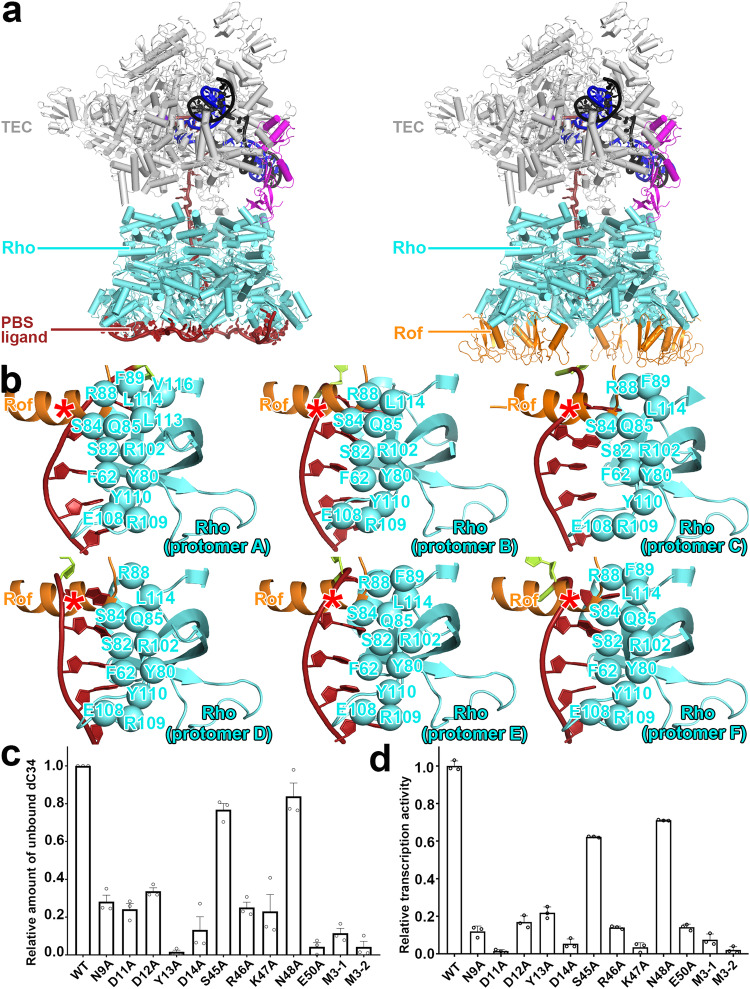
Fig. 2. Antitermination mechanism of Rof.
a Superposition of Rho-Rof antitermination complex with Rho-dependent pre-termination complex. Left panel, overall structures of Rho-dependent pre-termination complex with λtR1 rut RNA (λtR1-Rho-NusG-TEC). Rho, cyan; RNAP in TEC, grey; non-template strand DNA, template strand DNA, and RNA, black, blue, and brick-red, respectively; NusG, magenta. Right panel, exactly same view with left panel, each Rof-Rho protomer are superposed with structure of λtR1-Rho-NusG-TEC, and replaced λtR1 rut RNA with Rof. Rof, orange; other colors and labels are as left panel. b Details of interactions for Rof/λtR1 rut RNA with Rho protomers A-F. Rho residues that interact with PBS-ligand RNA are shown as cyan spheres. λtR1 rut RNA is shown as brick-red; Rof N-terminal α helix is shown as orange; the competing binding site of Rof and PBS-ligand RNA is marked by red asterisk. c Relative inhibition efficiency of Rof on Rho-dC34 complex identified by electrophoretic mobility shift assay. Substitutions of residues involved in Rof-Rho interactions suppressed Rof’s binding affinity with Rho thus decreased Rof’s inhibition efficiency on Rho-PBS ligand RNA (dC34) formation. Data for in vitro transcription assays are means of three technical replicates. Error bars represent ± SEM of n = 3 experiments. M3-1 represents N9A/D11A/D12A triple mutations, M3-2 represents R46A/K47A/N48A triple mutations. d Relative in vitro transcription activity with Rho and Rof. Substitutions of residues involved in Rof-Rho interactions suppressed Rof’s antitermination efficiency on Rho-dependent termination thus suppressed in vitro transcription activity. Data for in vitro transcription assays are means of three technical replicates. Error bars represent ± SEM of n = 3 experiments. M3-1 represents N9A/D11A/D12A triple mutations, M3-2 represents R46A/K47A/N48A triple mutations.

