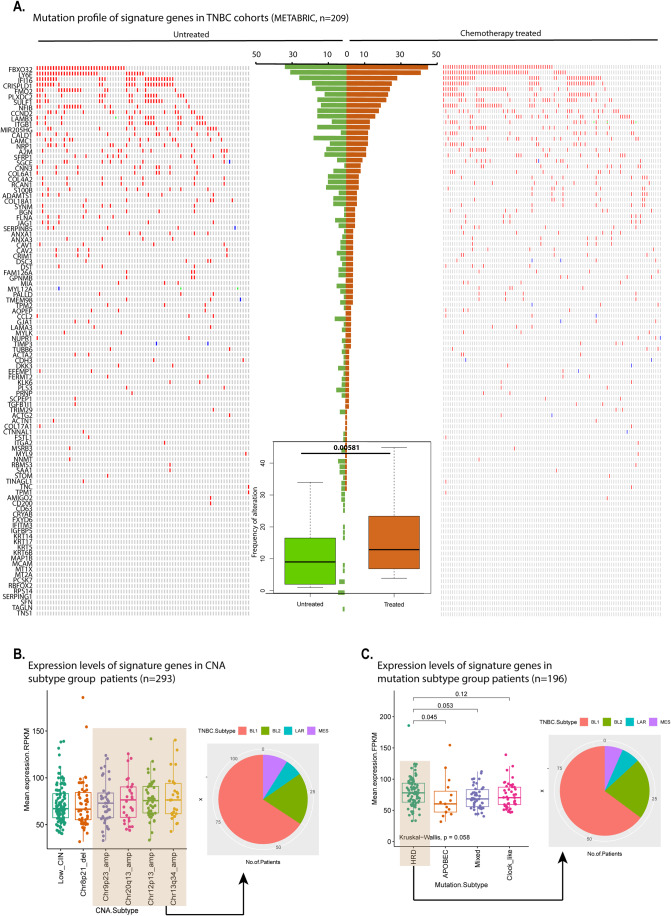
Figure 4. Elevated expression of signature genes in TNBC associated with an increased copy numbers, particularly in HRD subtype with basal-like characteristics.
Signature genes elevated in tumors of HRD subtype with increase copy numbers changes. (A) Oncoprint heatmap showing mutations and copy number alteration in METABARIC cohort. The left and right heatmap shows alternations in signature genes through deep deletion, amplification, missense, and truncating mutations in both chemotherapy-treated and -untreated TNBC patients. The bar graph in the center represents the frequency of mutations of each gene in TNBC patients. The boxplot in the center shows overall mutational frequency between chemotherapy-treated and untreated tumors. The significance test between chemotherapy-treated and untreated groups was performed using one-tailed paired t test. (B) The boxplot showing the expression of our signature genes among six previously defined CNA subtypes of TNBC (Jiang et al, 2019). (C) Boxplot showing mean expression of signature genes in four mutational subtypes of TNBC patients, homologous recombination deficiency (HRD), APOBEC, clock-like and mixed. HRD mutation type is defined by alteration in HRD-related genes; APOBEC type is defined by a mutation in APOBEC-related genes; clock-like is defined by a genetic alteration in clock-like genes, and mixed is defined by no dominant gene signature. The significance test between mutation subtypes was performed using two-tailed unpaired Wilcoxon test. (A, C) In the box-and-whisker plots, the horizontal lines mark the median, the box limits indicate the 25th and 75th percentiles, and the whiskers extend to 1.5× the interquartile range from the 25th and 75th percentiles. Source data are available online for this figure.

