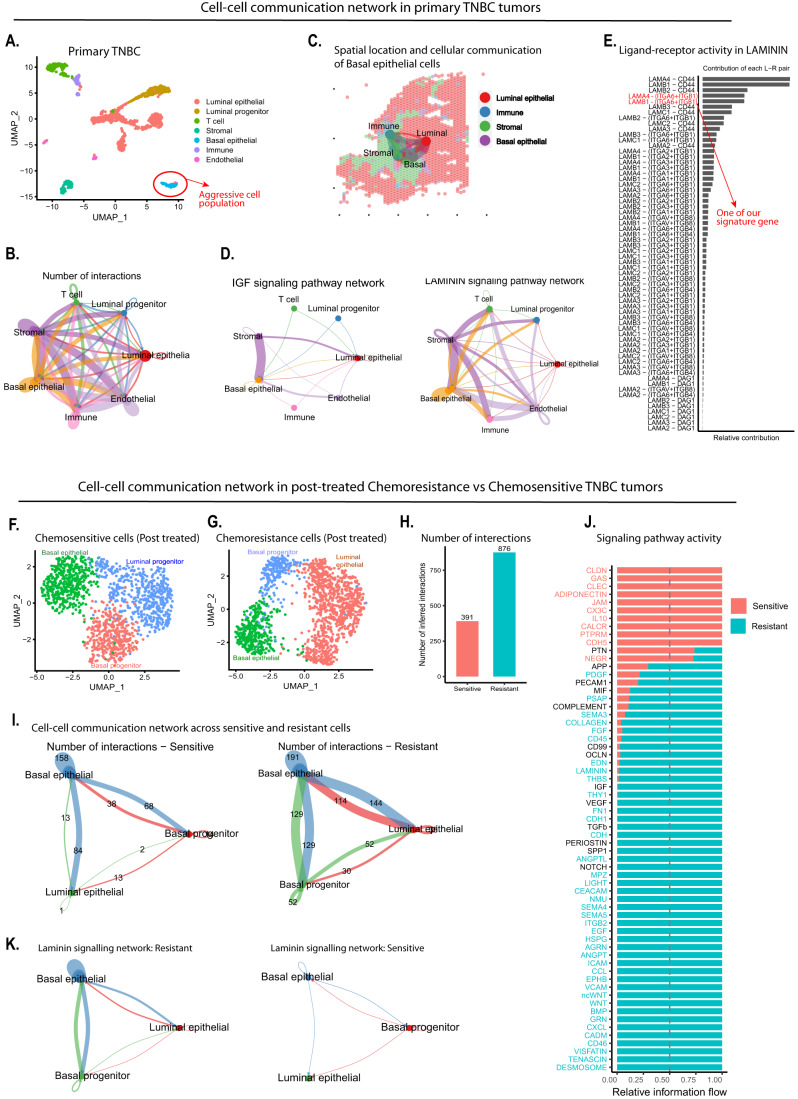
Figure 6. Chemoresistant cells communicate through distinct signaling pathways which is enhanced following exposure to chemotherapy.
(A) UMAP clusters of scRNA-seq datasets of primary TNBC tumors. (B) Circle plot showing number of interactions between the cell types in primary TNBC scRNA-seq dataset. (C) Cell–cell communication of the epithelial cells including basal epithelial with other cell types within TNBC spatial transcriptome dataset. The line and its width represent the strength of the cellular communications between the cell types on the histological section. (D) Circle plot showing key signaling pathways involved in intercellular communications between the basal and other cell types in TNBC. (E) Bar plot showing ligand-receptor interaction of LAMININ signaling pathway for intercellular communication in TNBC. (F, G) UMAP plot of post chemotherapy-treated chemoresistance and chemosensitive cells. (H) Bar plot showing the total number of interactions in the resistant and sensitive group of cells. (I) Circle plot showing the number of interactions between the cell types in chemosensitive and chemoresistant datasets. (J) Plot shows key signaling pathways enriched in chemoresistant and chemosensitive cells. (K) Circle plot showing the number of interactions of the intercellular signaling pathway in chemosensitive and chemoresistant cells. Source data are available online for this figure.

