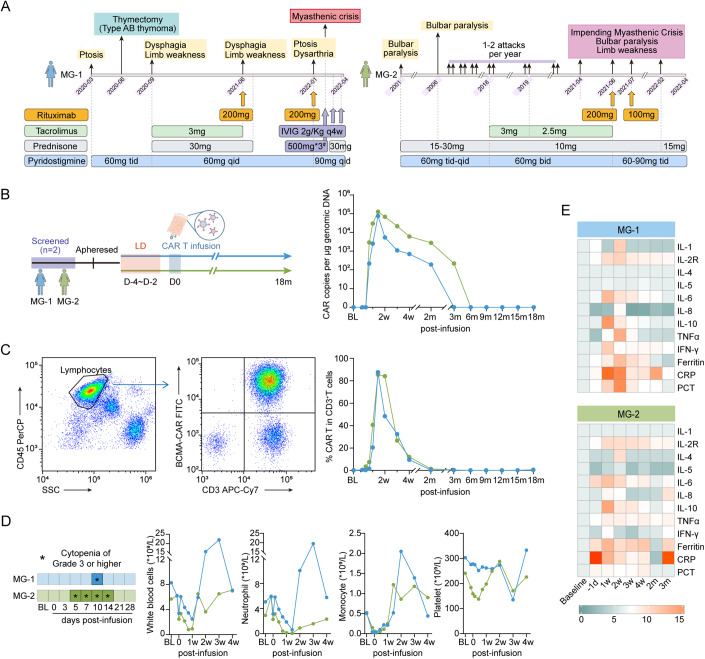
Figure 1. CAR T-cell kinetics and inflammatory mediators release following infusion.
(A) A schematic overview of the time points at which patients receive different treatments before CAR-T infusion. #Patient MG-1 was treated with IVIG 2 g/Kg + intravenous pulse steroid 500 mg* 3days for myasthenia crisis. (B) A schematic overview of CAR-T treatment procedure. CAR T-cell kinetics are shown by the CAR copies per μg genomic DNA at serial time points post infusion detected by droplet digital PCR. (C) Representative plots showing FACS analysis stained for CAR-T cells with FITC-labeled human BCMA Fc tag protein and APC/Cy7 anti-human CD3 antibody in patient MG-1 at day 10 after CAR T-cell infusion. CAR T-cell percentage in circulating CD3+ T lymphocytes at serial time points after treatment. (D) Timelines of patients with cytopenia of grade 3 or higher at baseline and indicated time points after CAR T-cell infusion. BL baseline. Kinetic changes in numbers of circulating total white blood cells, neutrophils, monocytes and platelets. (E) Heatmap depicting protein levels of inflammatory mediators in blood following CAR T-cell infusion. Interleukin IL, TNF tumor necrosis factor, IFN interferon, CRP C-reactive protein, PCT procalcitonin. Average levels are normalized from the baseline. Source data are available online for this figure.

