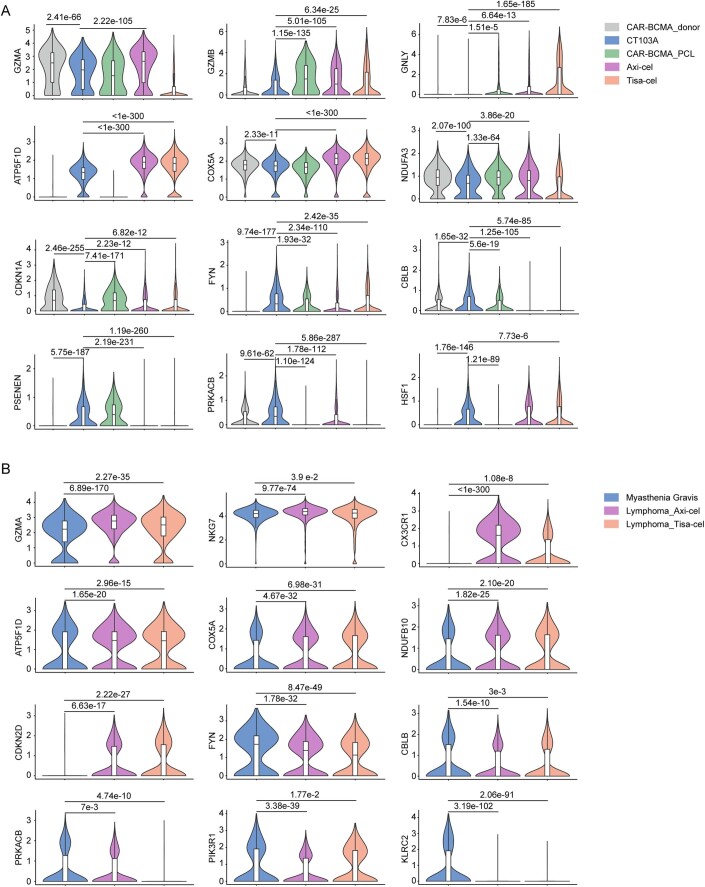
Figure EV4. Expression of indicated genes identifies characteristics of CD8 + Te cells (Baseline) and CD8+ cycling CAR-T cells (IP) in patients with myasthenia gravis.
(A) Violin plots illustrating indicated genes in Fig. 5B, and representing the distribution of expression across each product. CT103A, N = 4044 cells; CAR-BCMA_donor, N = 4739 cells; CAR-BCMA_PCL, N = 2111 cells; Axi-cel, N = 11,392 cells; Tisa-cel, N = 16,348 cells. Boxes show median, Q1 and Q3 quartiles and whiskers up to 1.5× interquartile range. Pairwise comparisons were performed using a two-sided Wilcoxon rank-sum test with a Bonferroni correction. (B) Violin plots illustrating indicated genes in Fig. 5C, and representing the distribution of expression across each cohort. Myasthenia Gravis, N = 2898 cells; Lymphoma_Axi-cel, N = 7123 cells; Lymphoma_Tisa-cel, N = 4857 cells. Boxes show median, Q1 and Q3 quartiles and whiskers up to 1.5× interquartile range. Pairwise comparisons were performed using a two-sided Wilcoxon rank-sum test with a Bonferroni correction.

