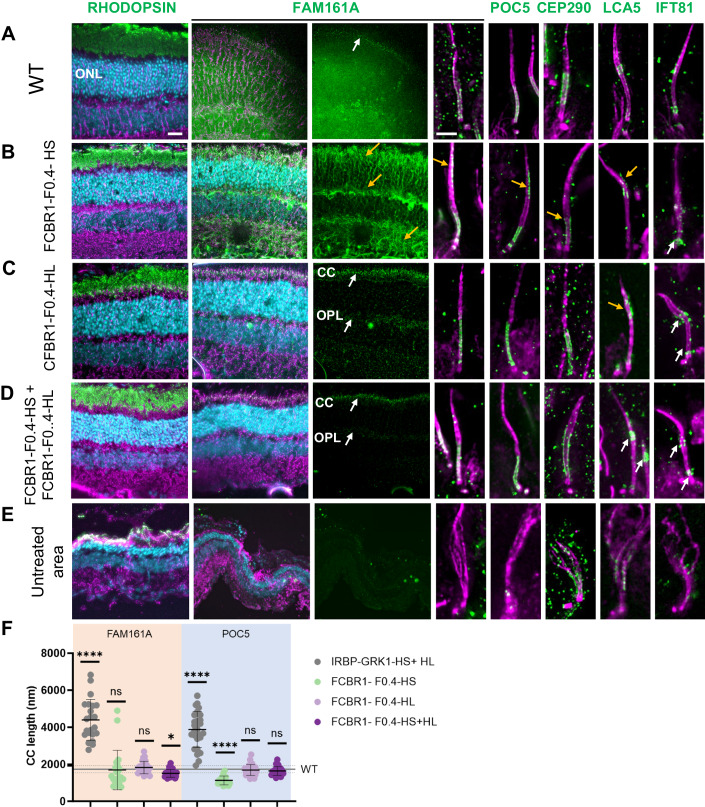
Figure 5. Co-expression of long and short isoforms produced with weak promoter and high vector dose restored cilium molecular structure.
U-ExM revealed the efficacy of the gene therapy treatment 3 months post injection. (A) Localization of proteins composing the CC in the WT retina. (B) Injection of FCBR1-F0.4-HS produced a marked rescue of the ONL (compared with (E)), but also ectopic expression of FAM161A and POC5 (see yellow arrows). Note the small size of the CEP290-positive CC (yellow arrow). The LCA5 labeling is discrete (yellow arrow), whereas the IFT81 labeling is correct (white arrows). (C) FCBR1-F0.4-HL also protected the retina and produced a correct localization of FAM161A at the CC and OPL levels as previously described (white arrows), but FAM161A labeling appeared too long in comparison to the WT CC (A, F). LCA5 is imperfectly expressed in the CC (orange arrow), but IFT81 appeared at the correct localization (white arrows). (D) The co-administration of the two FAM161A isoforms led to ONL protection, discrete FAM161A expression in the CC and OPL (white arrows), and correct localization of FAM161A, POC5, CEP290, LCA5 as well as IFT81 (white arrows). (F) Quantification of FAM161A- and POC5-positive CC lengths. Note that the CC is longer for the IRBP-GRK1-HS + IRBP-GRK1-HL group (P < 0.0001) and shorter for the FCBR1-F0.4-HS group (P < 0.0001) compared to the WT CC length determined by POC5 staining (mean and SD represented as horizontal plain and dotted line, respectively). One-way ANOVA Kruskal–Wallis test followed by Dunn’s test for multiple comparisons of all groups to the control WT group; *P < 0.05; ****P < 0.0001. (A) Low magnification FAM161A labelings from flatmount retina are shown, whereas all other panels are stainings on cryosection. Scale bars: 20 μm and 1 μm for low and high magnification, respectively. HS human short isoform, HL human long isoform, ONL outer nuclear layer, CC connecting cilium, OPL outer plexiform layer. White arrows: correct labeling; orange arrows: modified labeling. Data information: Results in (A–E) are representative of two sections (A, C–E) or three sections (B) from one eye for each group. Results in (F) using FAM161A labeling were obtained from measurements of 22 connecting cilia for IRBP-GRK1-HS + HL, 21 for FCBR1-F0.4-HS, 24 for FCBR1-F0.4-HL, and 27 for FCBR1-F0.4-HS + HL. Results in (F) using POC5 labeling were obtained from measurements of 27 connecting cilia for IRBP-GRK1-HS + HL, 16 for FCBR1-F0.4-HS, 28 for FCBR1-F0.4-HL, 24 for FCBR1-F0.4-HS + HL and 70 for WT. Source data are available online for this figure.

