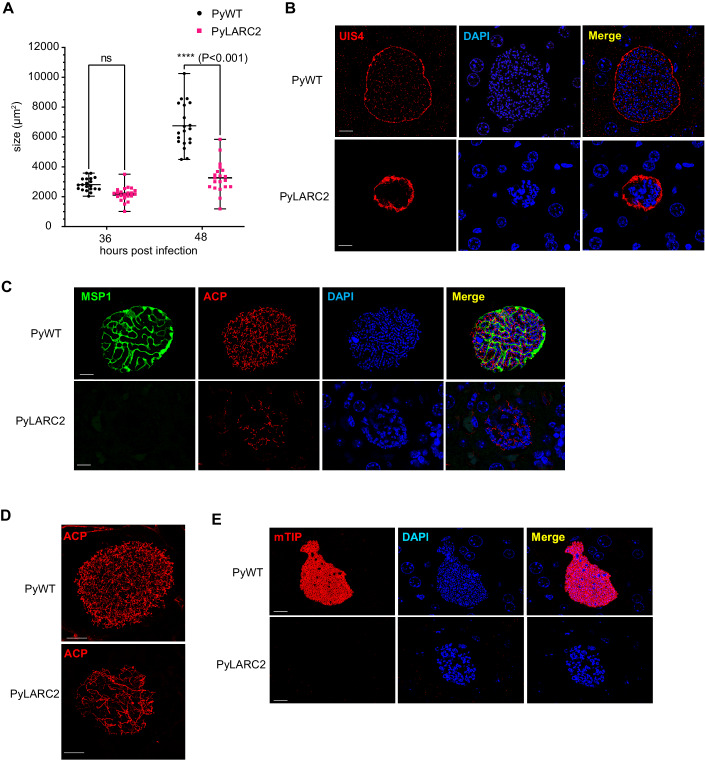
Figure 1. PyLARC2 shows a complete late liver stage developmental arrest.
Liver tissue sections were prepared from BALB/cByJ mice infected with 250,000 (250 K) sporozoites of either Py XNL (PyWT) or PyLARC2, 36 and 48 h post infection (hpi) and analyzed by IFA. (A) Comparison of LS parasite size (based on area at the LS largest circumference) between PyWT and PyLARC2 at 36 and 48 hpi. This analysis indicates that sizes of replicating LS schizonts at 36 hpi are comparable between PyWT and PyLARC2. However, PyLARC2 late LS schizonts at 48 hpi are significantly smaller than PyWT. Data is represented as mean ± SD. Each datapoint refers to the mean size of at least 20 parasites for each timepoint. Statistical analysis was carried out using two-way ANOVA using Tukey’s multiple comparison test. P value is mentioned in the figure legend. P > 0.05 is taken as ns. LS development was compared between PyWT and PyLARC2 at 48 hpi using antibodies against; (B) the PVM marker UIS4 (red); (C) the PPM and mature LS merozoite marker, MSP1 (green), and apicoplast marker, ACP (red); (D) the apicoplast marker, ACP (red) with a 3D projection; (E) the inner membrane complex and mature LS merozoite marker, mTIP (red). DNA was stained with DAPI (blue). Scale bar is 10 μm. PyLARC2 LS parasites are smaller compared to PyWT and do not express mature merozoite markers MSP1 and mTIP, indicating a lack of LS merozoite formation. Furthermore, organellar and DNA segregation is incomplete in PyLARC2 LS. The apicoplast appears tubular and disorganized and DAPI staining displays large and aggregated DNA centers. In contrast, mature PyWT LS have defined cytomeres visualized with MSP1. The apicoplast and DNA are segregated along cytomere boundaries and in mature LS display complete segregation into LS merozoites. Source data are available online for this figure.

