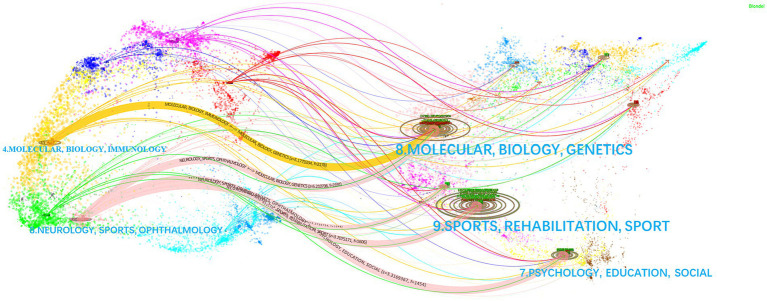
Figure 5.
Two-map overlay of cited/cited journals for AI research in spinal cord neural injury and restoration. Each publication is added to two interrelated but different global science maps, with the citing publication on the left and the cited publication on the right. Each point on this map is an article with a corresponding magazine. The curves are citation links representing citation paths. The ellipses represent the citation frequency of the clusters. The data for the five curves in the figure are (z = 5.177, f = 2,178), (z = 5.211, f = 2,191), (z = 2.274, f = 1,048), (z = 3.708, f = 1,606), and (z = 3.317, f = 1,454). f: frequency of citations from left citing journals to right cited journals, z: normalization to the value of f. z and f represent the closeness and importance of the linkage.

