Figure 1.

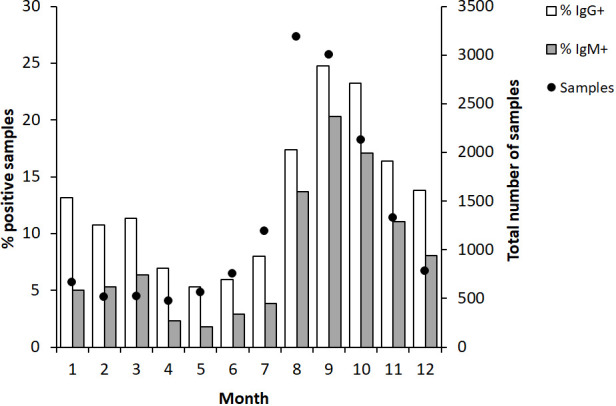
Monthly proportion of IgG and IgM positive serum samples (bars) and numbers of serum samples analyzed each month (dot). The serum samples were collected from patients in Sweden with suspected tularemia during the period 2010 to 2022.

Monthly proportion of IgG and IgM positive serum samples (bars) and numbers of serum samples analyzed each month (dot). The serum samples were collected from patients in Sweden with suspected tularemia during the period 2010 to 2022.